R में plotly के साथ इंटरएक्टिव डेटा विज़ुअलाइज़ेशन
Adam Loy
Statistician, Carleton College
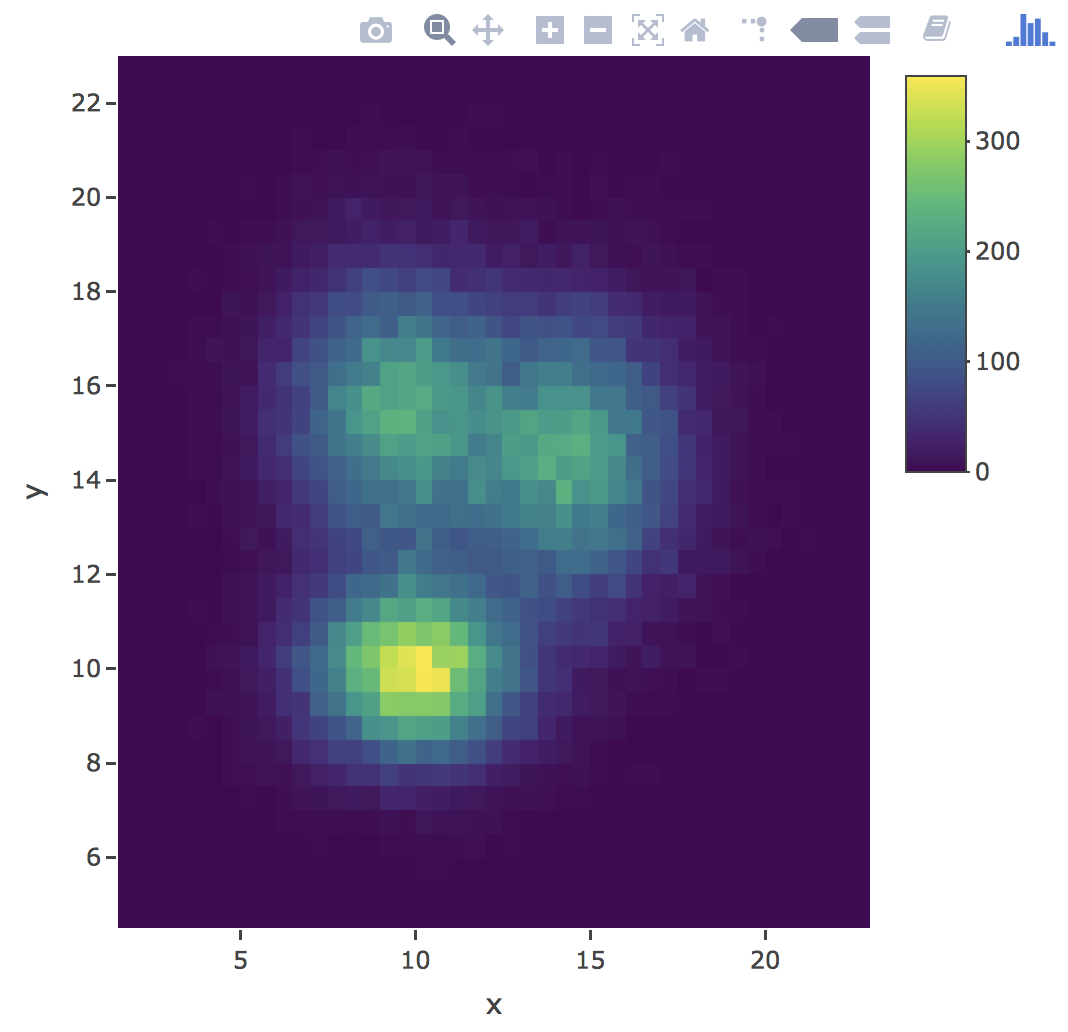
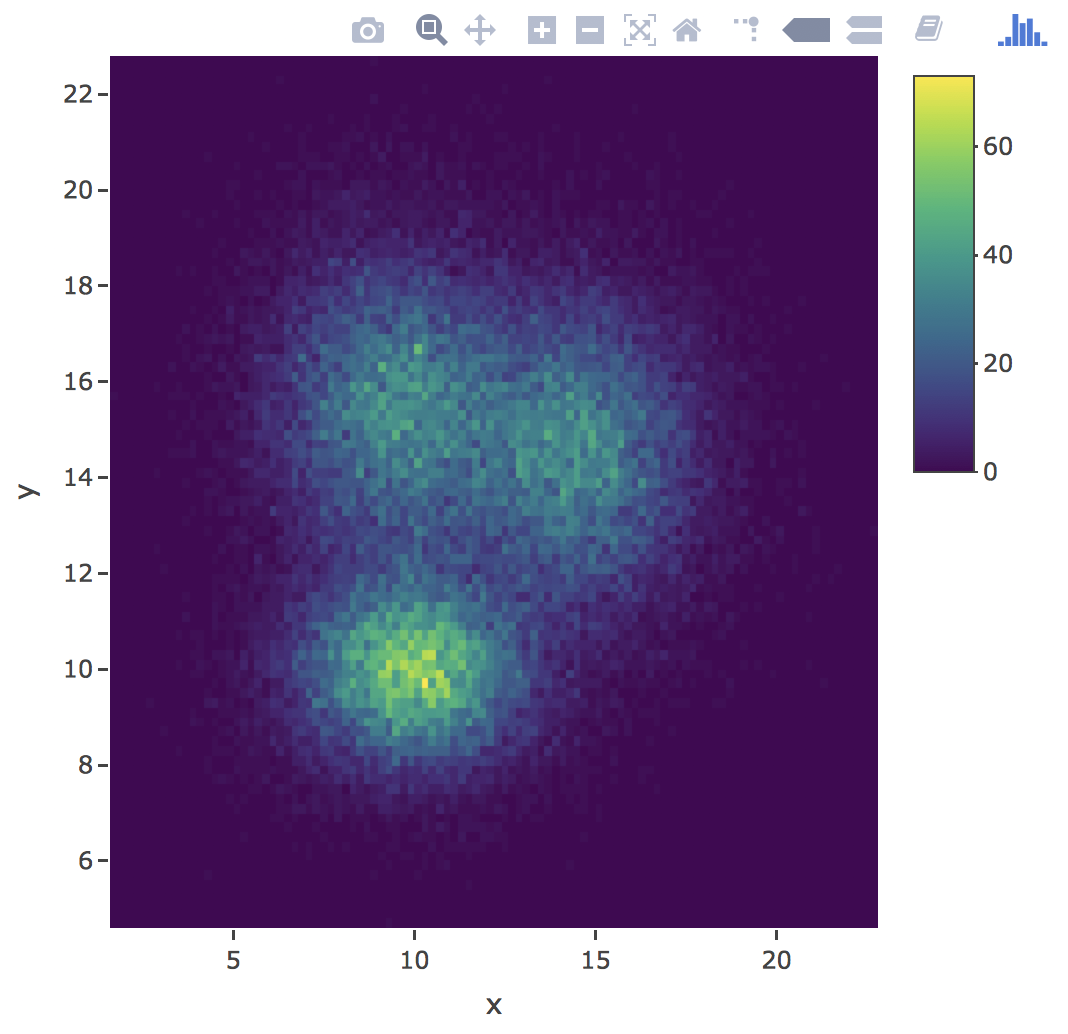
sim_data %>%
  plot_ly(x = ~x, y = ~y) %>%
  add_histogram2d()
sim_data %>%
  plot_ly(x = ~x, y = ~y) %>%
  add_histogram2d(nbinsx = 200, nbinsy = 100)