एकल वैरिएबल का प्लॉटिंग

R में plotly के साथ इंटरएक्टिव डेटा विज़ुअलाइज़ेशन

Adam Loy

Statistician, Carleton College

वाइन डेटा की जाँच

library(dplyr)
glimpse(wine)
Rows: 178
Columns: 14
$ Type            <fct> 1, 1, 1, 1, 1, 1, 1, 1, 1, 1, 1, 1, 1, 1, 1, 1...
$ Alcohol         <dbl> 14.23, 13.20, 13.16, 14.37, 13.24, 14.20, 14.3...
$ Malic           <dbl> 1.71, 1.78, 2.36, 1.95, 2.59, 1.76, 1.87, 2.15...
...
$ Hue             <dbl> 1.04, 1.05, 1.03, 0.86, 1.04, 1.05, 1.02, 1.06...
$ Dilution        <dbl> 3.92, 3.40, 3.17, 3.45, 2.93, 2.85, 3.58, 3.58...
$ Proline         <int> 1065, 1050, 1185, 1480, 735, 1450, 1290, 1295,...
R में plotly के साथ इंटरएक्टिव डेटा विज़ुअलाइज़ेशन

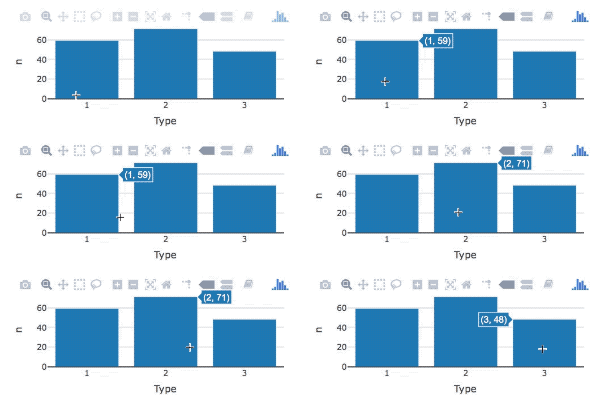
plotly के साथ बार चार्ट

12_bars.gif

library(plotly)

wine %>%
   count(Type) %>%                 
   plot_ly(x = ~Type, y = ~n) %>% 
   add_bars()
  • count() से फ़्रीक्वेंसी टेबल बनाएँ
  • ~ से aesthetics बताइए
  • add_bars() से bars trace जोड़ें
R में plotly के साथ इंटरएक्टिव डेटा विज़ुअलाइज़ेशन

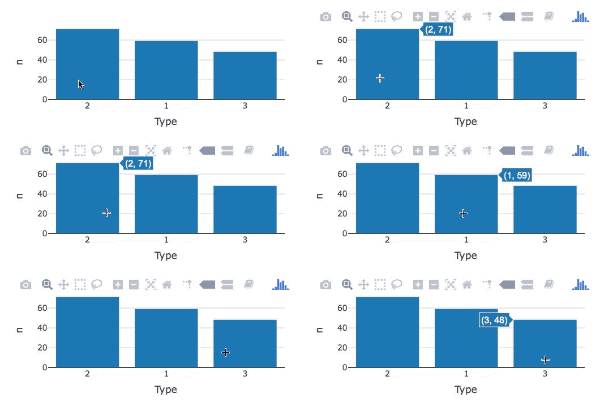
बार्स का क्रम बदलना

12_bars_reorder.gif

library(forcats)
wine %>%
  count(Type) %>%                 
  mutate(Type = fct_reorder(Type, n, .desc = TRUE)) %>% 
  plot_ly(x = ~Type, y = ~n) %>%
  add_bars()
  • bars पुनःक्रमित करने के लिए fct_reorder()
  • .desc आर्ग्युमेंट को TRUE सेट करें
R में plotly के साथ इंटरएक्टिव डेटा विज़ुअलाइज़ेशन

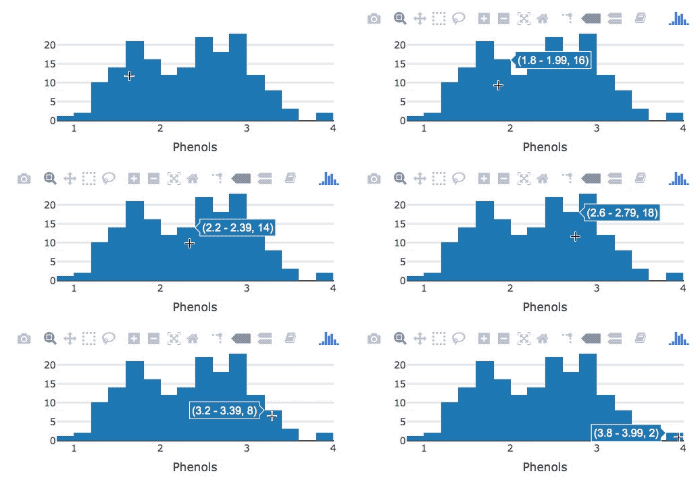
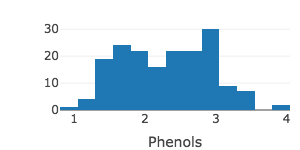
plotly के साथ हिस्टोग्राम

12_histogram.gif

wine %>%
   plot_ly(x = ~Phenols) %>%  # aesthetics तय करें

add_histogram() # histogram trace जोड़ें
R में plotly के साथ इंटरएक्टिव डेटा विज़ुअलाइज़ेशन

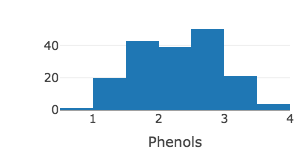
बिन की संख्या समायोजित करना

wine %>%
   plot_ly(x = ~Phenols) %>% 
   add_histogram(nbinsx = 10)
R में plotly के साथ इंटरएक्टिव डेटा विज़ुअलाइज़ेशन

बिन चौड़ाई समायोजित करना

wine %>%
   plot_ly(x = ~Phenols) %>% 
   add_histogram(xbins = list(start = 0.8, end = 4, size = 0.25))
R में plotly के साथ इंटरएक्टिव डेटा विज़ुअलाइज़ेशन

अभ्यास करते हैं!

R में plotly के साथ इंटरएक्टिव डेटा विज़ुअलाइज़ेशन

Preparing Video For Download...