R में Feature Engineering
Jorge Zazueta
Research Professor and Head of the Modeling Group at the School of Economics, UASLP
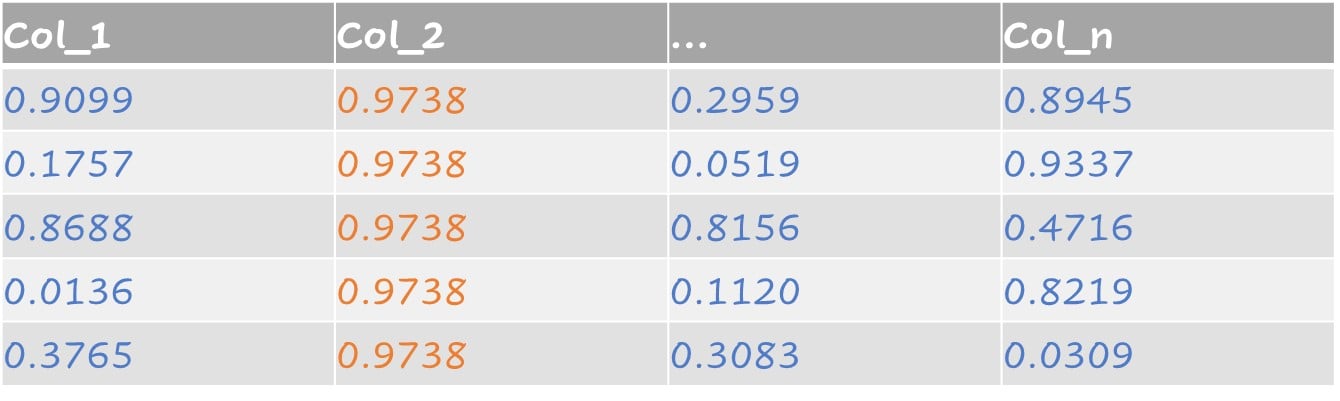
कुछ डेटासेट्स में ऐसे कॉलम होते हैं जिनकी वैल्यू स्थिर होती है या variance शून्य होता है. इन्हें फ़िल्टर करने के लिए recipe() में step_zv() जोड़ें.

Near-zero variance फीचर्स में वे प्रेडिक्टर्स शामिल हैं जिनकी वैल्यू एक ही हो, और वे जिनमें नीचे दोनों विशेषताएँ हों:
सैंपल्स की संख्या की तुलना में बहुत कम यूनिक वैल्यूज़
सबसे आम वैल्यू की फ़्रीक्वेंसी का दूसरी सबसे आम वैल्यू की फ़्रीक्वेंसी से अनुपात बड़ा हो
Near-zero variance का उदाहरण:
step_nzv() ऐसे प्रेडिक्टर्स को पहचानकर हटाता है.
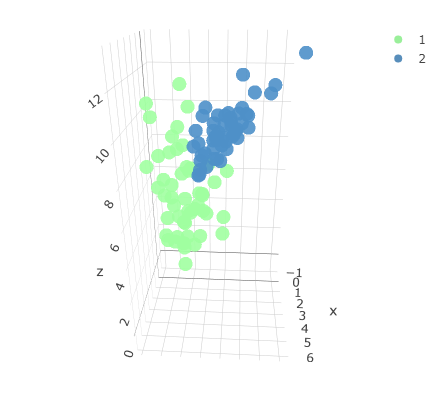
मूल तीन-डाइमेंशनल डेटासेट, दो क्लासेज के साथ.
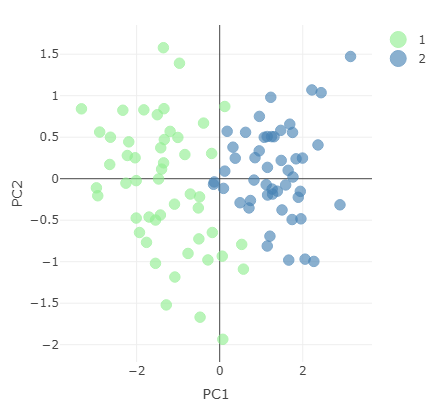
पहले दो principal components से रिप्रेज़ेंट किया गया घटाया हुआ डेटासेट.
PCA चलाने के लिए एक recipe बनाएँ और prep() से आउटपुट लें.
pc_recipe <-
recipe(~., data = loans_num) %>%
step_nzv(all_numeric()) %>%
step_normalize(all_numeric()) %>%
step_pca(all_numeric())
pca_output <- prep(pc_recipe)
उपलब्ध जानकारी देखने के लिए pca_output पर names() कॉल करें.
names(pca_output)
[1] "var_info" "term_info"
[3] "steps" "template"
[5] "levels" "retained"
[7] "requirements" "tr_info"
[9] "orig_lvls" "last_term_info"
pca_output ऑब्जेक्ट से standard deviation निकालें और variance explained निकालें.
stdv <- pca_output$steps[[3]]$res$sdev
var_explained <- stdv^2/sum(stdv^2)
PCA = tibble(PC = 1:length(stdv),
var_explained = var_explained,
cumulative = cumsum(var_explained))
तालिका: प्रत्येक principal component द्वारा समझाया गया variance.
# A tibble: 5 × 3
PC var_explained cumulative
<int> <dbl> <dbl>
1 1 0.315 0.315
2 2 0.214 0.529
3 3 0.202 0.730
4 4 0.198 0.928
5 5 0.0722 1
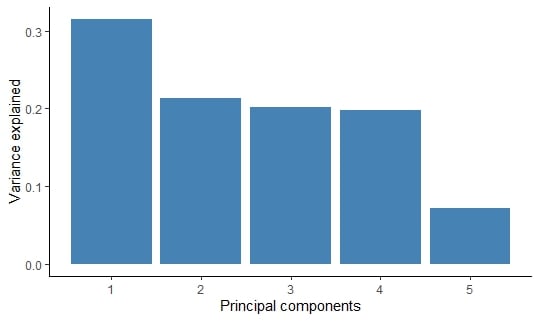
ggplot2 से आउटपुट को कॉलम चार्ट के रूप में प्लॉट कर सकते हैं.
PCA %>%
ggplot(aes(x = PC,
y = var_explained)) +
geom_col(fill = "steelblue") +
xlab("Principal components") +
ylab("Variance explained")
Principal component द्वारा समझाया गया variance.

R में Feature Engineering