Two sample t-test

Python में सर्वे डेटा का विश्लेषण

EbunOluwa Andrew

Data Scientist

Agreeableness की तुलना

लोग हाथ मिलाते हुए

group_a.agreeableness.mean()
4.011701199563795
group_b.agreeableness.mean()
4.03669574700109
Python में सर्वे डेटा का विश्लेषण

Two sample t-test की परिभाषा

  • जाँचता है कि दो स्वतंत्र समूहों के means में महत्वपूर्ण अंतर है या नहीं
  • तय करें कि अंतर संयोग से तो नहीं

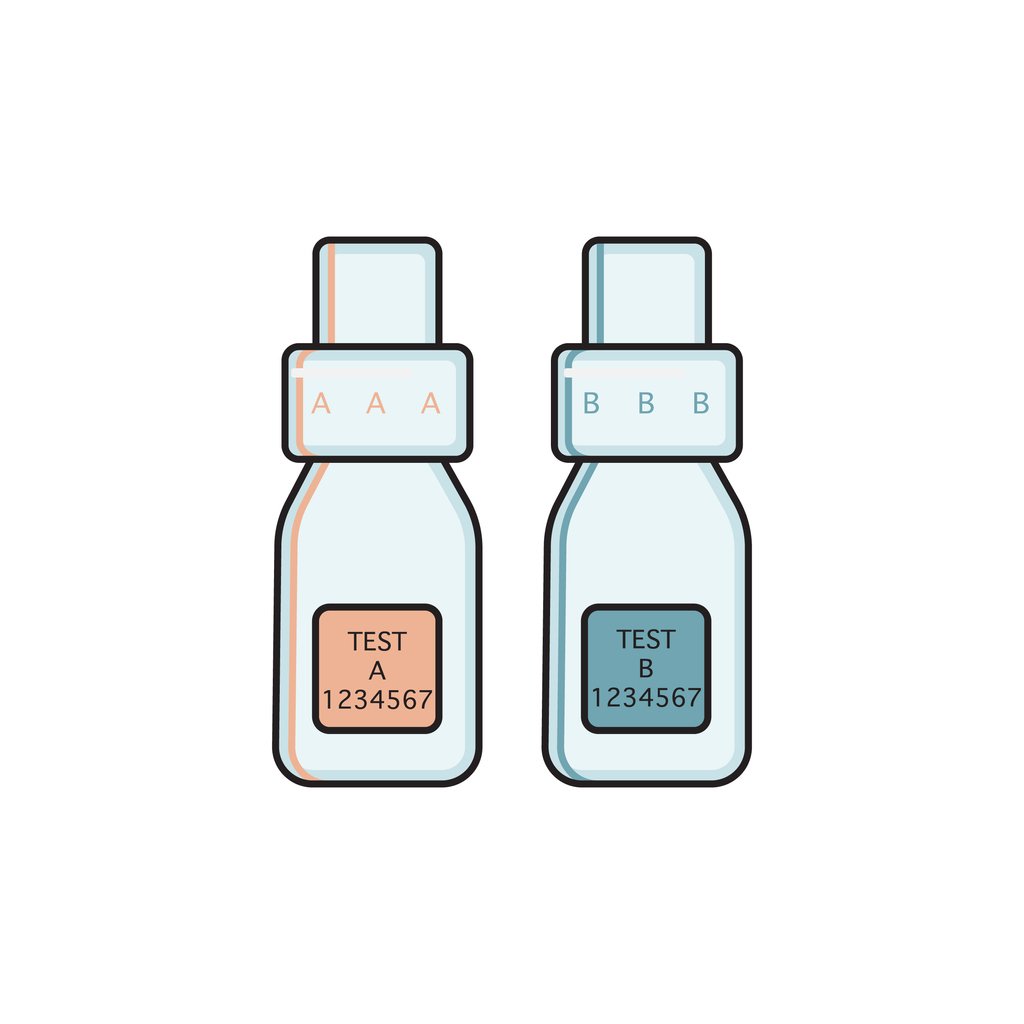
A और B लेबल वाली बोतलों की जोड़ी

Python में सर्वे डेटा का विश्लेषण

Two sample t-test की मान्यताएँ

  • स्वतंत्र
  • Normal distribution
    • Shapiro-Wilk test
    • stats.shapiro()
    • p-value > 0.05 -> normally distributed
  • समान variances
    • Levene test
    • stats.levene()
    • p-value > 0.05 -> equal variances

लकड़ी के ब्लॉक्स पर संख्या

Python में सर्वे डेटा का विश्लेषण

Survey परिणाम

group_a

| userid | agreeableness |
|--------|---------------|
|    895 |          4.78 |
|    a06 |          3.40 |
|    e94 |          3.66 |
|    ee6 |          5.41 |
|    521 |          4.58 |
|    f4c |          3.24 |
...

1 = Non-agreeable

group_b

| userid | agreeableness |
|--------|---------------|
|    b7e | 4.43          |
|    030 | 2.92          |
|    f91 | 4.01          |
|    36f | 2.20          |
|    875 | 3.83          |
|    750 | 4.95          |
...

7 = Agreeable

Python में सर्वे डेटा का विश्लेषण

स्वतंत्र समूह

दो समूह

Python में सर्वे डेटा का विश्लेषण

Normally distributed समूह

from scipy.stats import shapiro
import scipy.stats as stats

norm_A = stats.shapiro(
  group_a.agreeableness)

ShapiroResult(
statistic=0.997467577457428,
pvalue=0.16834689676761627)
from scipy.stats import shapiro
import scipy.stats as stats

norm_B = stats.shapiro(
  group_b.agreeableness)

ShapiroResult(
statistic=0.9987381100654602,
pvalue=0.7757995128631592)
Python में सर्वे डेटा का विश्लेषण

समान variances

import scipy.stats as stats

var_test = stats.levene(group_a.agreeableness, group_b.agreeableness)
LeveneResult(statistic=0.40492634057696597, pvalue=0.5246354858484796)
Python में सर्वे डेटा का विश्लेषण

मान्यताएँ जाँची गईं

  • स्वतंत्र समूह
    • व्यक्तियों में कोई ओवरलैप नहीं
  • Normally distributed समूह
  • समान variances
    • दोनों variances में कोई महत्वपूर्ण अंतर नहीं

Apple Pencil-Photo by Dose Media on Unsplash

Python में सर्वे डेटा का विश्लेषण

statsmodels के साथ Two sample t-test

from scipy import stats

stats.ttest_ind(group_a.agreeableness, group_b.agreeableness)
Python में सर्वे डेटा का विश्लेषण

statsmodels के साथ Two sample t-test

Ttest_indResult(statistic=0.7746406648066304, pvalue=0.4386519848366188)
Python में सर्वे डेटा का विश्लेषण

आगे का विश्लेषण

group_a_mean = 4.011701199563795
group_b_mean = 4.03669574700109

कैलिफ़ोर्निया में आवास

Python में सर्वे डेटा का विश्लेषण

अभ्यास करते हैं!

Python में सर्वे डेटा का विश्लेषण

Preparing Video For Download...