क्लस्टर सैंपलिंग

Python में सर्वे डेटा का विश्लेषण

EbunOluwa Andrew

Data Scientist

क्लस्टर सैंपलिंग क्या है?

  • पूरी आबादी को कई उपसमूहों में बाँटा जाता है

    • उपसमूहों के गुण आबादी जैसे होते हैं
  • आबादी -> क्लस्टर

  • व्यक्तियों का सैंपल नहीं, बल्कि यादृच्छिक रूप से पूरा उपसमूह चुना जाता है

लोगों से बना पाई चार्ट

Python में सर्वे डेटा का विश्लेषण

क्लस्टर सैंपलिंग क्यों महत्वपूर्ण है

  • हम हमेशा पूरी आबादी से डेटा नहीं जुटा सकते
  • बड़ी आबादी से होने वाली त्रुटि को कम करें

जनसंख्या अधिक होना

Python में सर्वे डेटा का विश्लेषण

क्लस्टर सैंपलिंग के चरण

  • पहले, आबादी को क्लस्टर में बाँटें
  • फिर, इन क्लस्टर का रैंडम चयन करें

लोगों के क्लस्टर

Python में सर्वे डेटा का विश्लेषण

नमूना डेटासेट

print(mh_survey)
| gender | sought_treatment | country_work             |
|--------|------------------|--------------------------|
| Male   |                0 | United Kingdom           |
| Male   |                1 | United States of America |
| Male   |                1 | United Kingdom           |
| Male   |                1 | United Kingdom           |
| Female |                1 | United States of America |
| Male   |                1 | United Kingdom           |
| Male   |                0 | United States of America |
...
Python में सर्वे डेटा का विश्लेषण

नमूना डेटासेट और प्लॉट

mh_survey.groupby('country_work')[
  'gender'].count()
groups = mh_survey.groupby(
  'country_work')['gender'].count(
).reset_index()
groups.columns=['country_work','count']

groups.plot.bar(x='country_work',
                y='count')

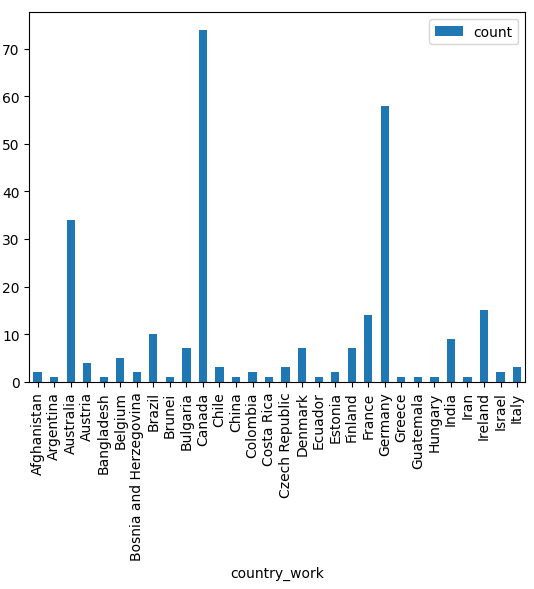
टेक वर्कर्स कहाँ रहते हैं का बार प्लॉट

1 _जगह की कमी के कारण आंशिक डेटा प्लॉट किया गया_
Python में सर्वे डेटा का विश्लेषण

क्लस्टर चुनें

unique_countries = list(set(mh_survey.country_work))

random_clusters = np.random.choice(unique_countries, size = 10, replace = False)

print(random_clusters)
array(['Finland', 'Australia', 'Sweden', 'South Africa', 'Pakistan',
       'France', 'Ecuador', 'United Arab Emirates', 'United Kingdom',
       'Bangladesh'], dtype='<U24')
Python में सर्वे डेटा का विश्लेषण

क्लस्टर सैंपल बनाएँ

cluster_sample = mh_survey[mh_survey.country_work.isin(random_clusters)]
print(cluster_sample.head())
| gender | sought_treatment | US_state_live        |
|--------|------------------|----------------------|
| Male   |                1 |             Pakistan |
| Male   |                1 |             Pakistan |
| Male   |                1 | United Arab Emirates |
| Male   |                1 |             Pakistan |
| Female |                0 |           Bangladesh |
Python में सर्वे डेटा का विश्लेषण

क्लस्टर सैंपल प्लॉट करें

treatment_pie = cluster_sample.sought_treatment.value_counts(normalize = True)
treatment_pie.plot.pie()

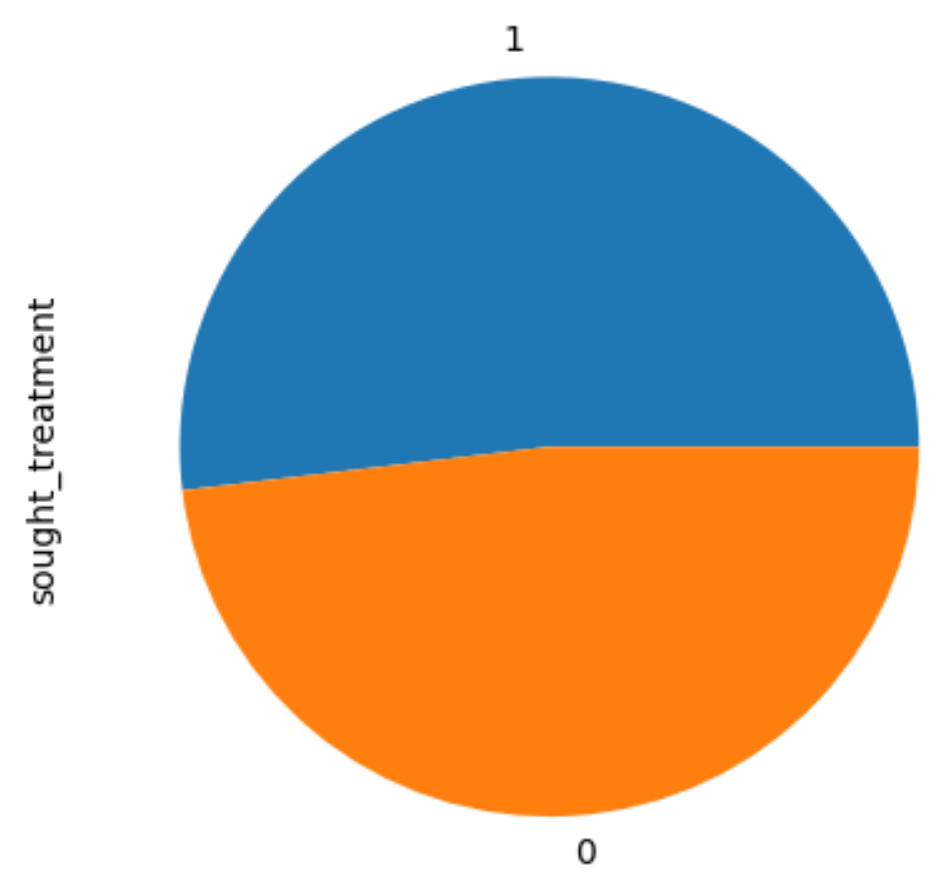
sought_treatment का पाई प्लॉट

Python में सर्वे डेटा का विश्लेषण

क्लस्टर सैंपल प्लॉट करें

array(['Bangladesh', 'South Africa', 'Other', 'Norway', 'Poland',
       'Romania', 'New Zealand', 'France', 'United States of America',
       'Bulgaria'], dtype='<U24')

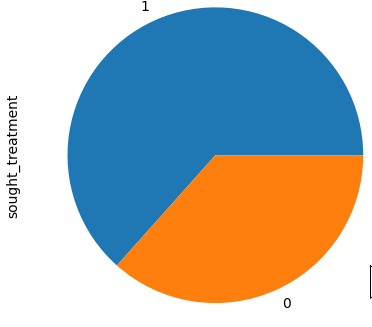
sought_treatment का पाई प्लॉट

Python में सर्वे डेटा का विश्लेषण

अभ्यास करते हैं!

Python में सर्वे डेटा का विश्लेषण

Preparing Video For Download...