flexdashboard के साथ डैशबोर्ड बनाना
Elaine McVey
Director of Data Science
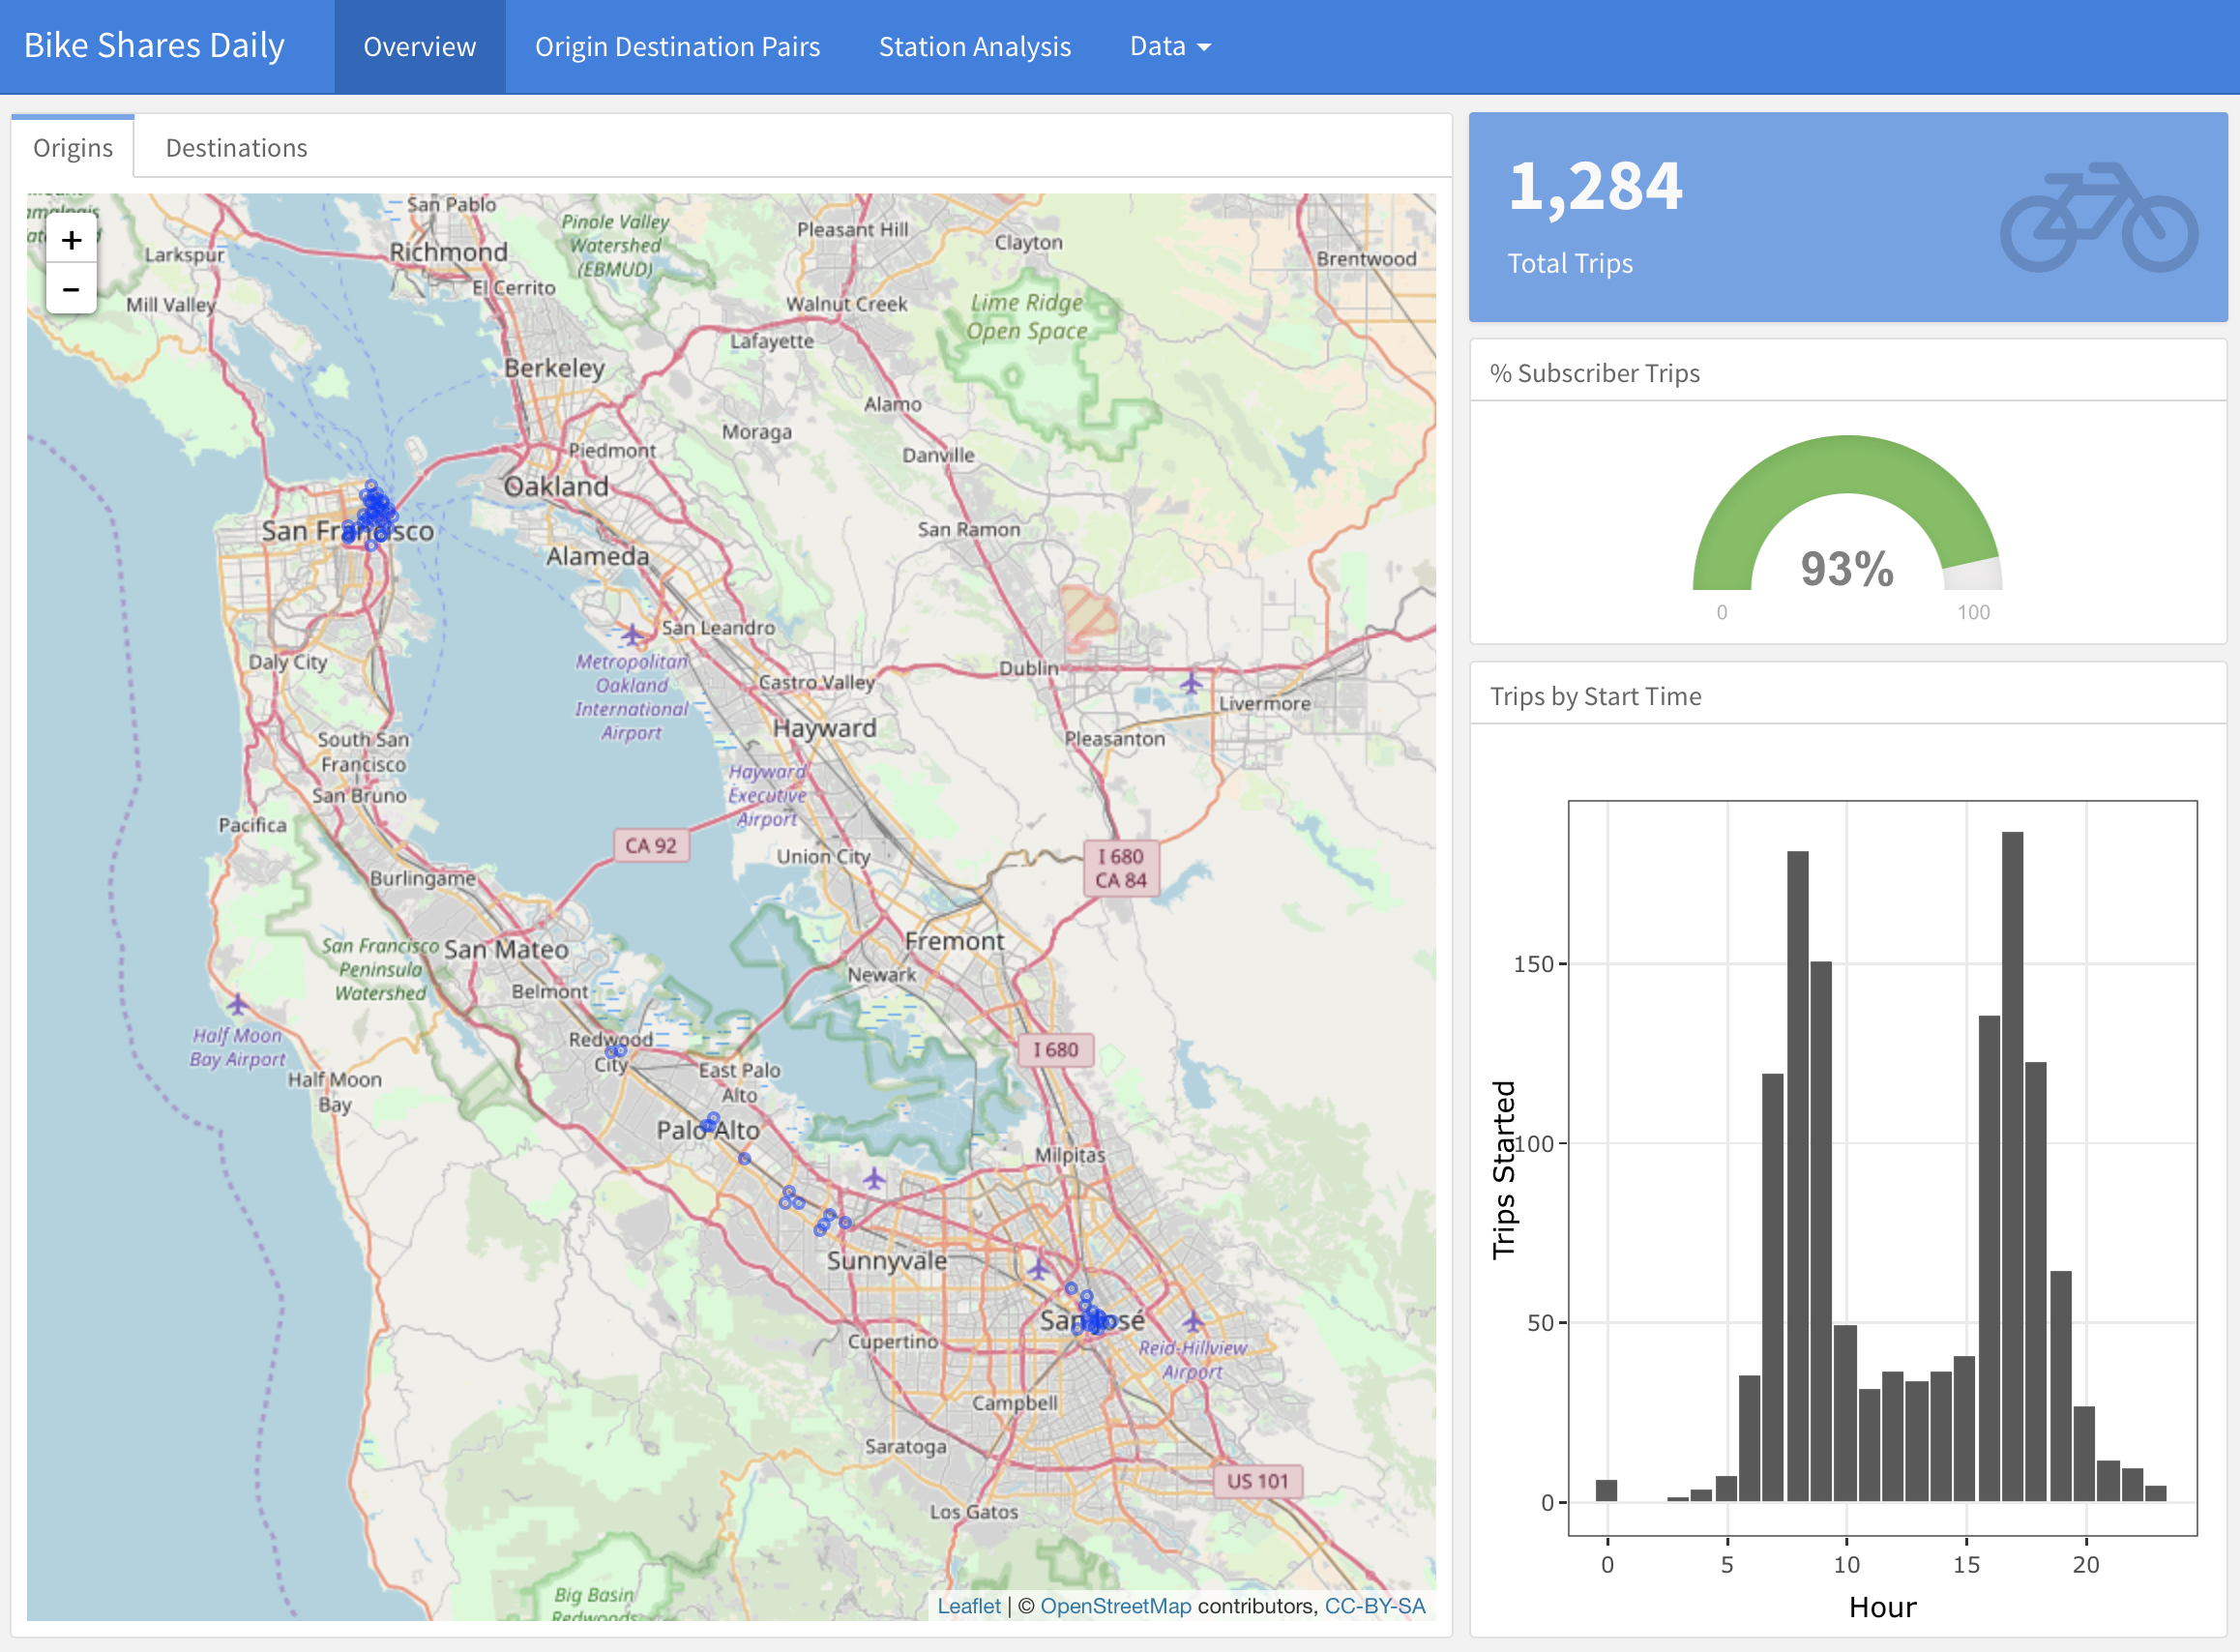
gauge(value = pct_subscriber_trips,
      min = 0,
      max = 100)

gauge(value = pct_subscriber_trips,
      min = 0,
      max = 100,
      sectors = gaugeSectors(
                  success = c(90, 100),
                  warning = c(70, 89),
                  danger = c(0, 69)
                  ),
      symbol = '%')
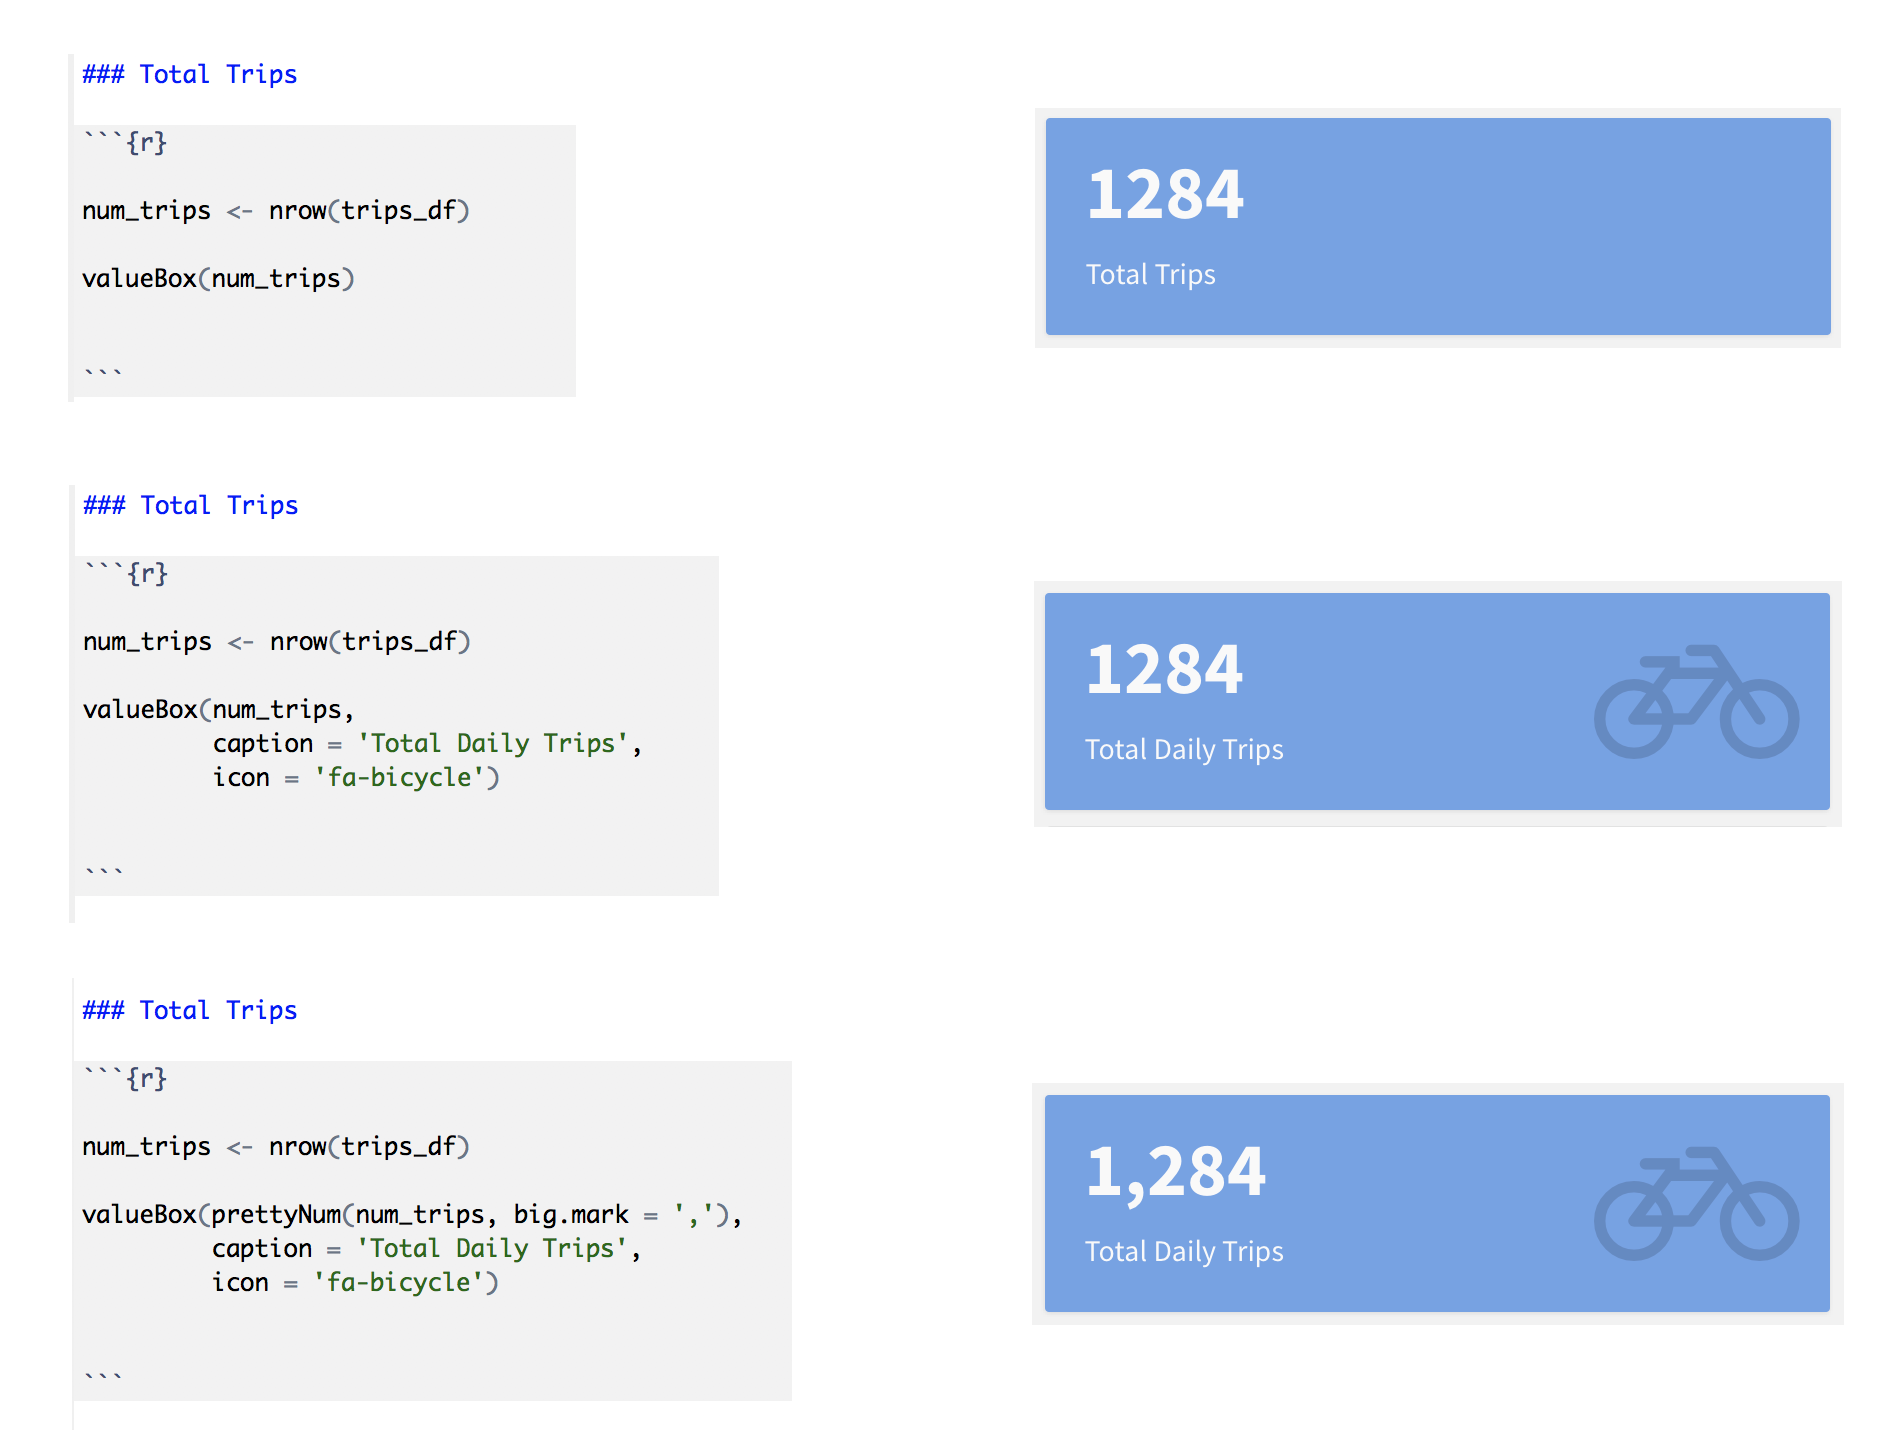
valueBox(prettyNum(num_trips, big.mark = ','),
         caption = 'Total Daily Trips',
         icon = 'fa-bicycle',
         href = '#trip-raw-data')