R में बिज़नेस प्रोसेस एनालिटिक्स
Gert Janssenswillen
Creator of bupaR

इवेंट लॉग के दायरे का अंदाज़ा लगाएँ
library(bupaR)
यह जानकारी इवेंट लॉग का सारांश प्रिंट करके देखी जा सकती है
summary(learning)
या काउंट फंक्शंस से।
n_cases(learning)
498
n_activities(learning)
10
एक्टिविटीज़ प्रोसेस के फ्लो को बताती हैं
activity_labels(learning)
[1] "Consult Dictionary" "Consult Theory Pages" "Exercise 1"
[4] "Exercise 2" "Exercise 3" "Exercise 4"
[7] "Exercise 5" "Exercise 6" "Exercise 7"
[10] "Assessment"
activities(learning)
# A tibble: 10 x 3
action absolute_frequency relative_frequency
<chr> <dbl> <dbl>
1 Exercise 1 516 0.142
2 Assessment 498 0.137
3 Exercise 2 493 0.135
4 Exercise 4 442 0.121
5 Exercise 3 436 0.120
6 Exercise 5 360 0.0988
7 Exercise 6 302 0.0829
8 Exercise 7 299 0.0820
9 Consult Dictionary 165 0.0453
हर केस एक्टिविटीज़ के क्रम से वर्णित होता है, इसे उसका ट्रेस कहते हैं.
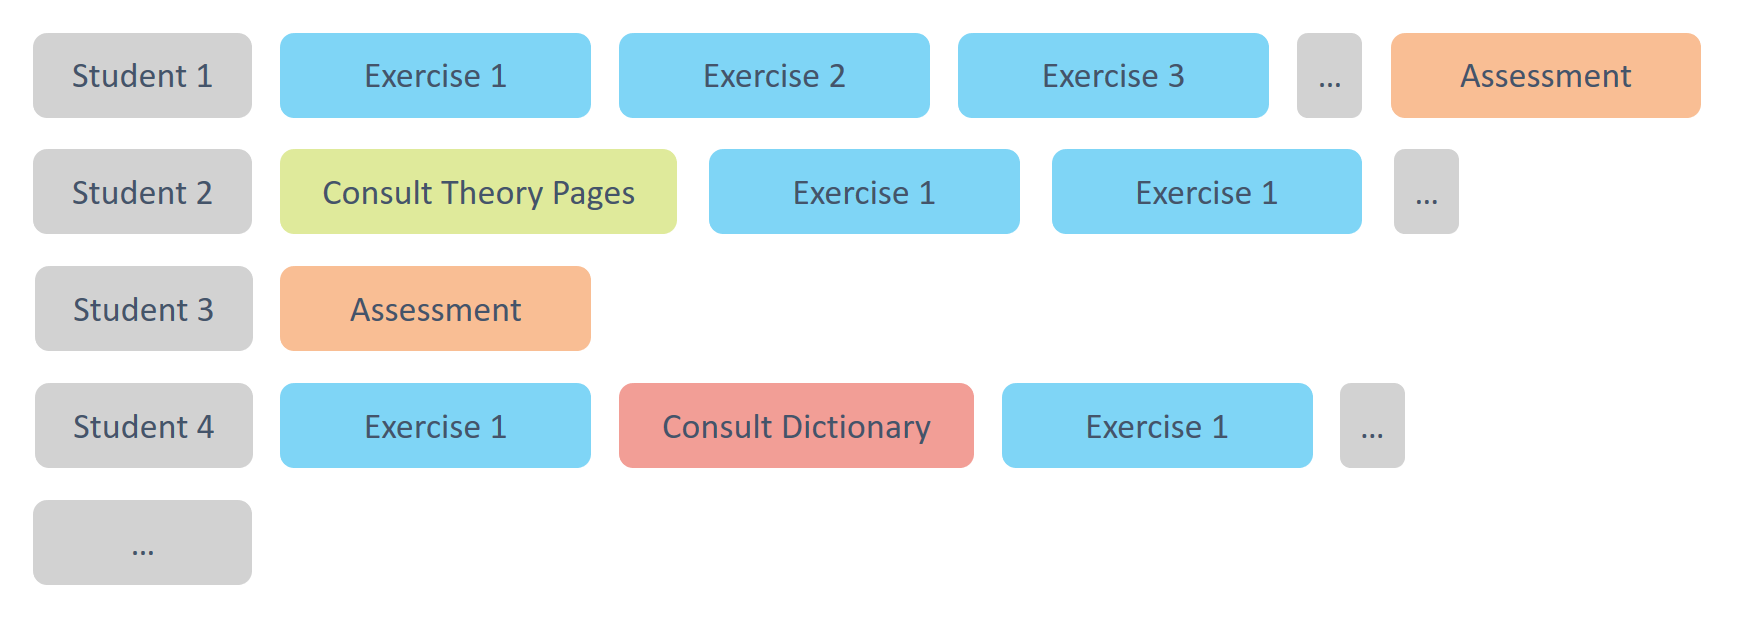
traces फंक्शन से मिलती हैtraces(learning)
trace_explorer फंक्शन से विज़ुअलाइज़ कर सकते हैंtrace_explorer(learning)
R में बिज़नेस प्रोसेस एनालिटिक्स