बार्स हटाना

Julia के साथ डेटा विज़ुअलाइज़ेशन परिचय

Gustavo Vieira Suñe

Data Analyst

बार चार्ट्स
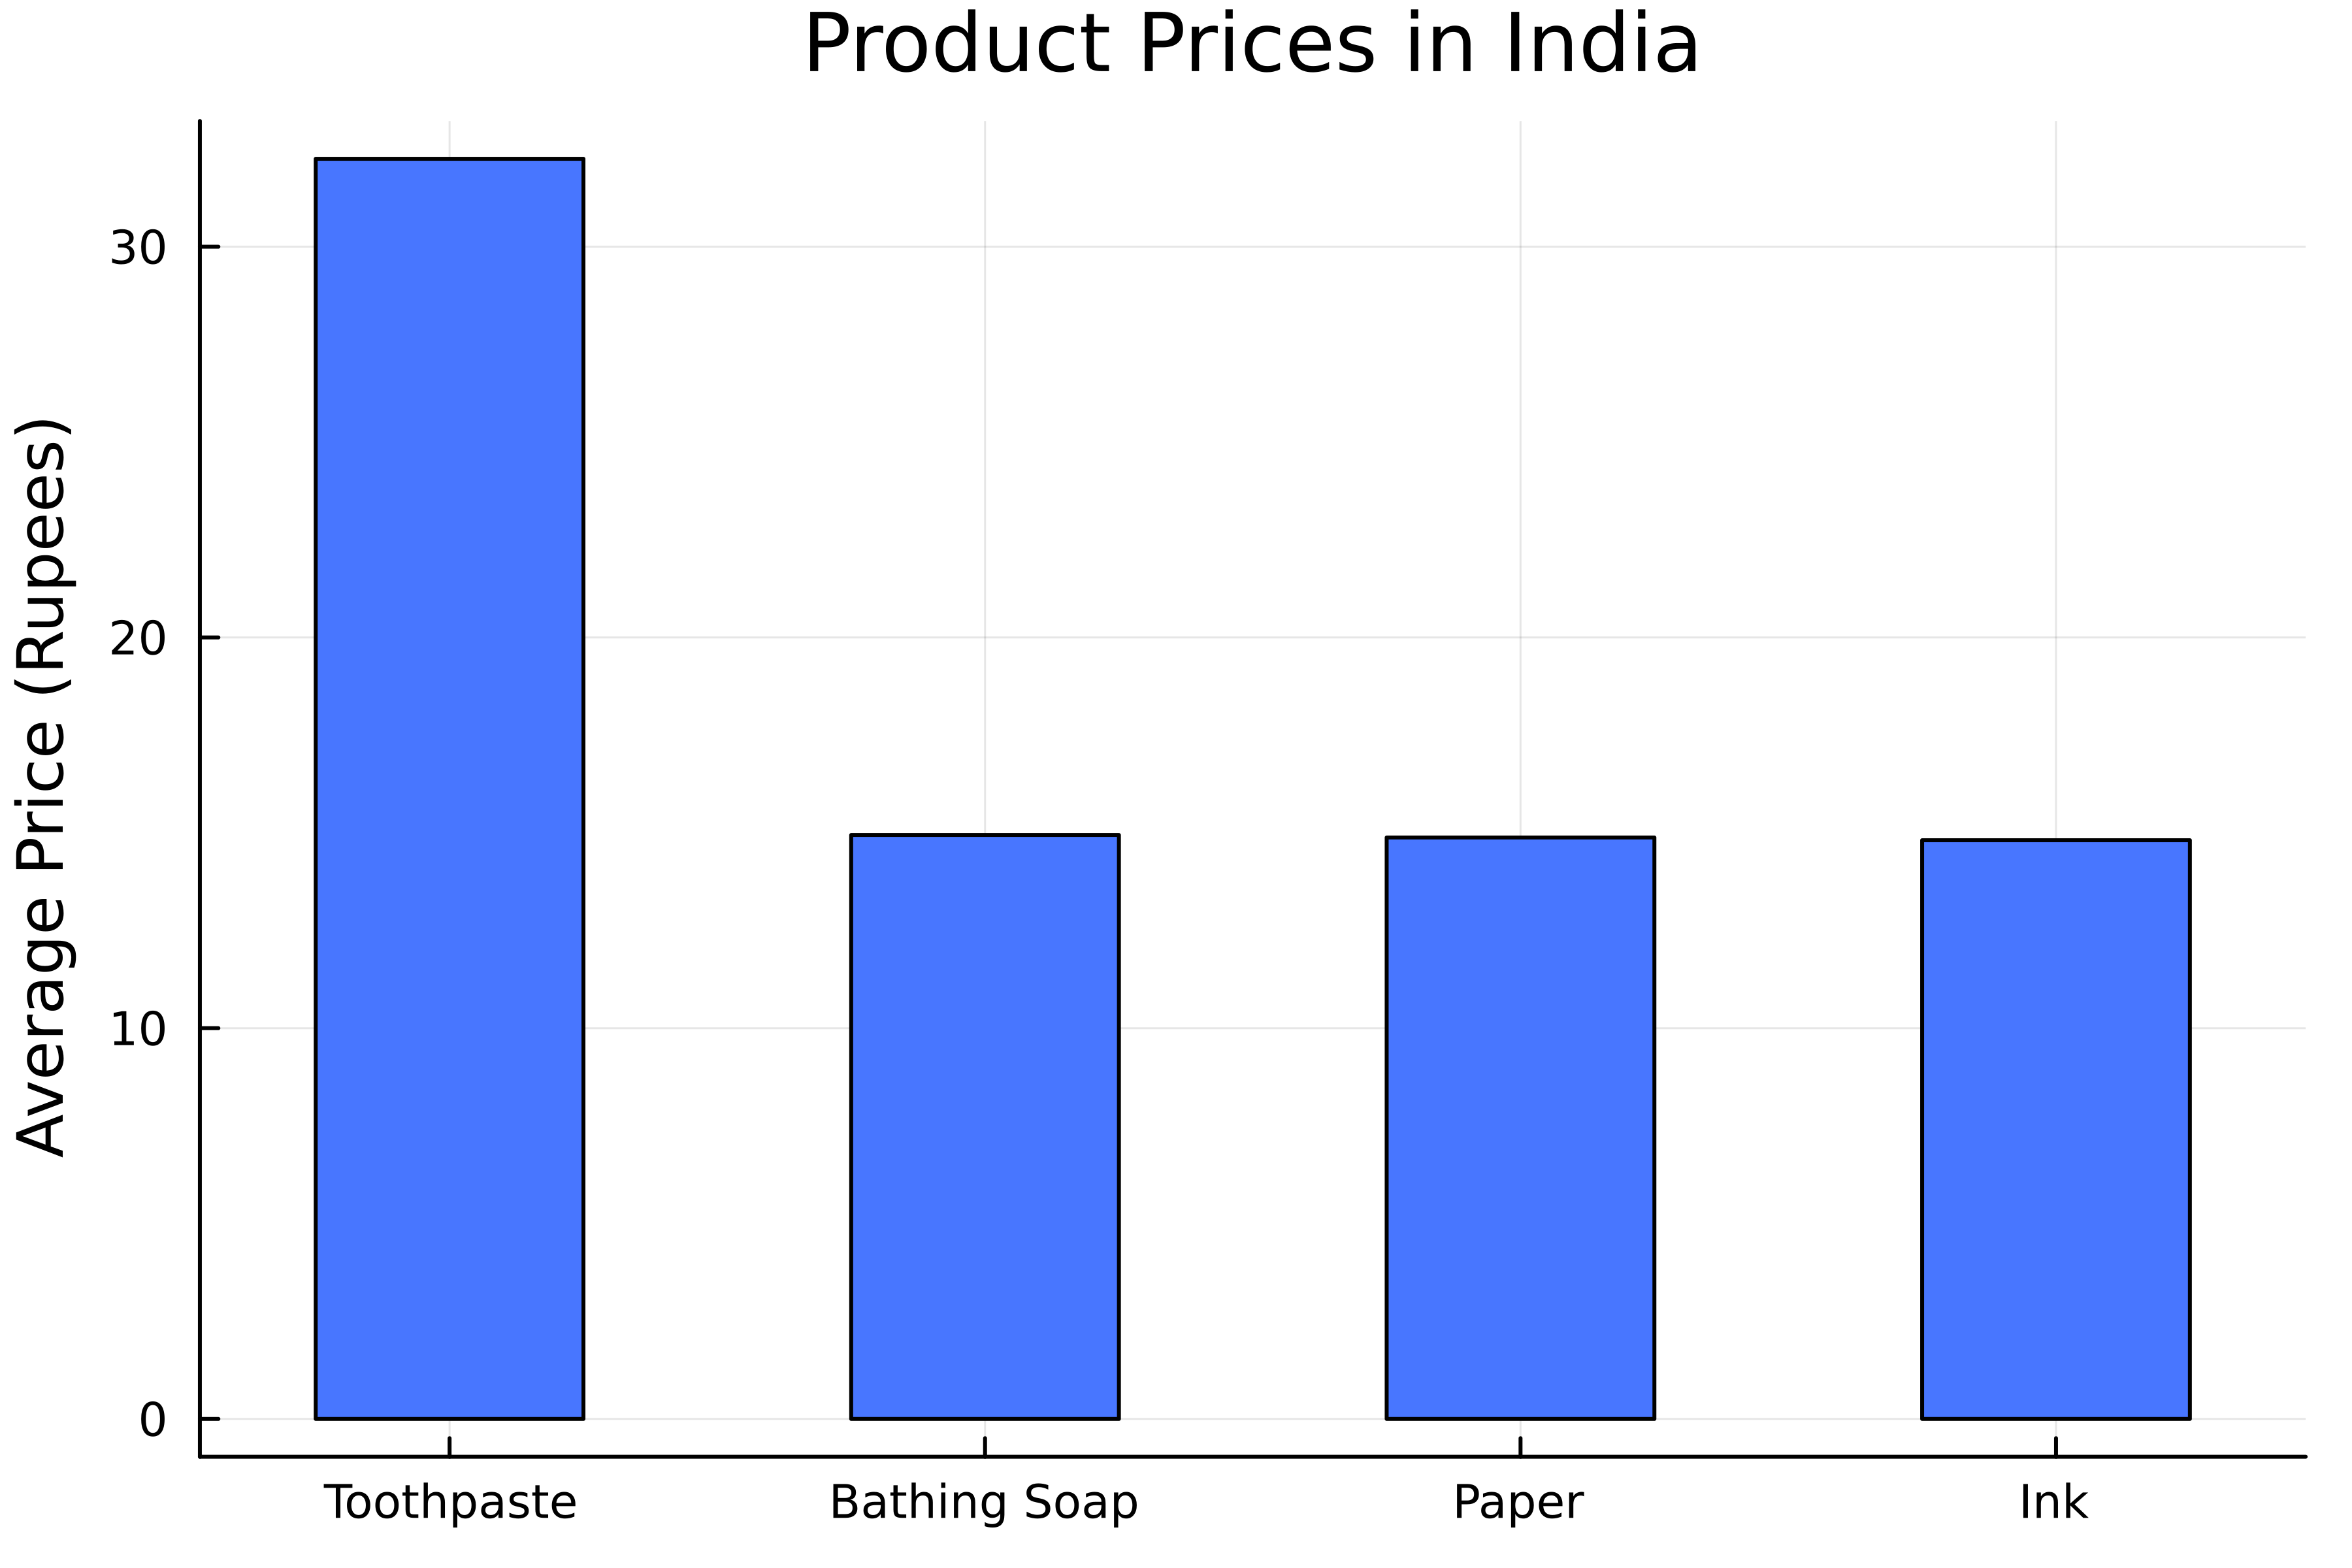
भारत में अलग-अलग उत्पादों के औसत दाम दिखाता एक बार चार्ट.

Julia के साथ डेटा विज़ुअलाइज़ेशन परिचय

बार चार्ट बनाम हिस्टोग्राम

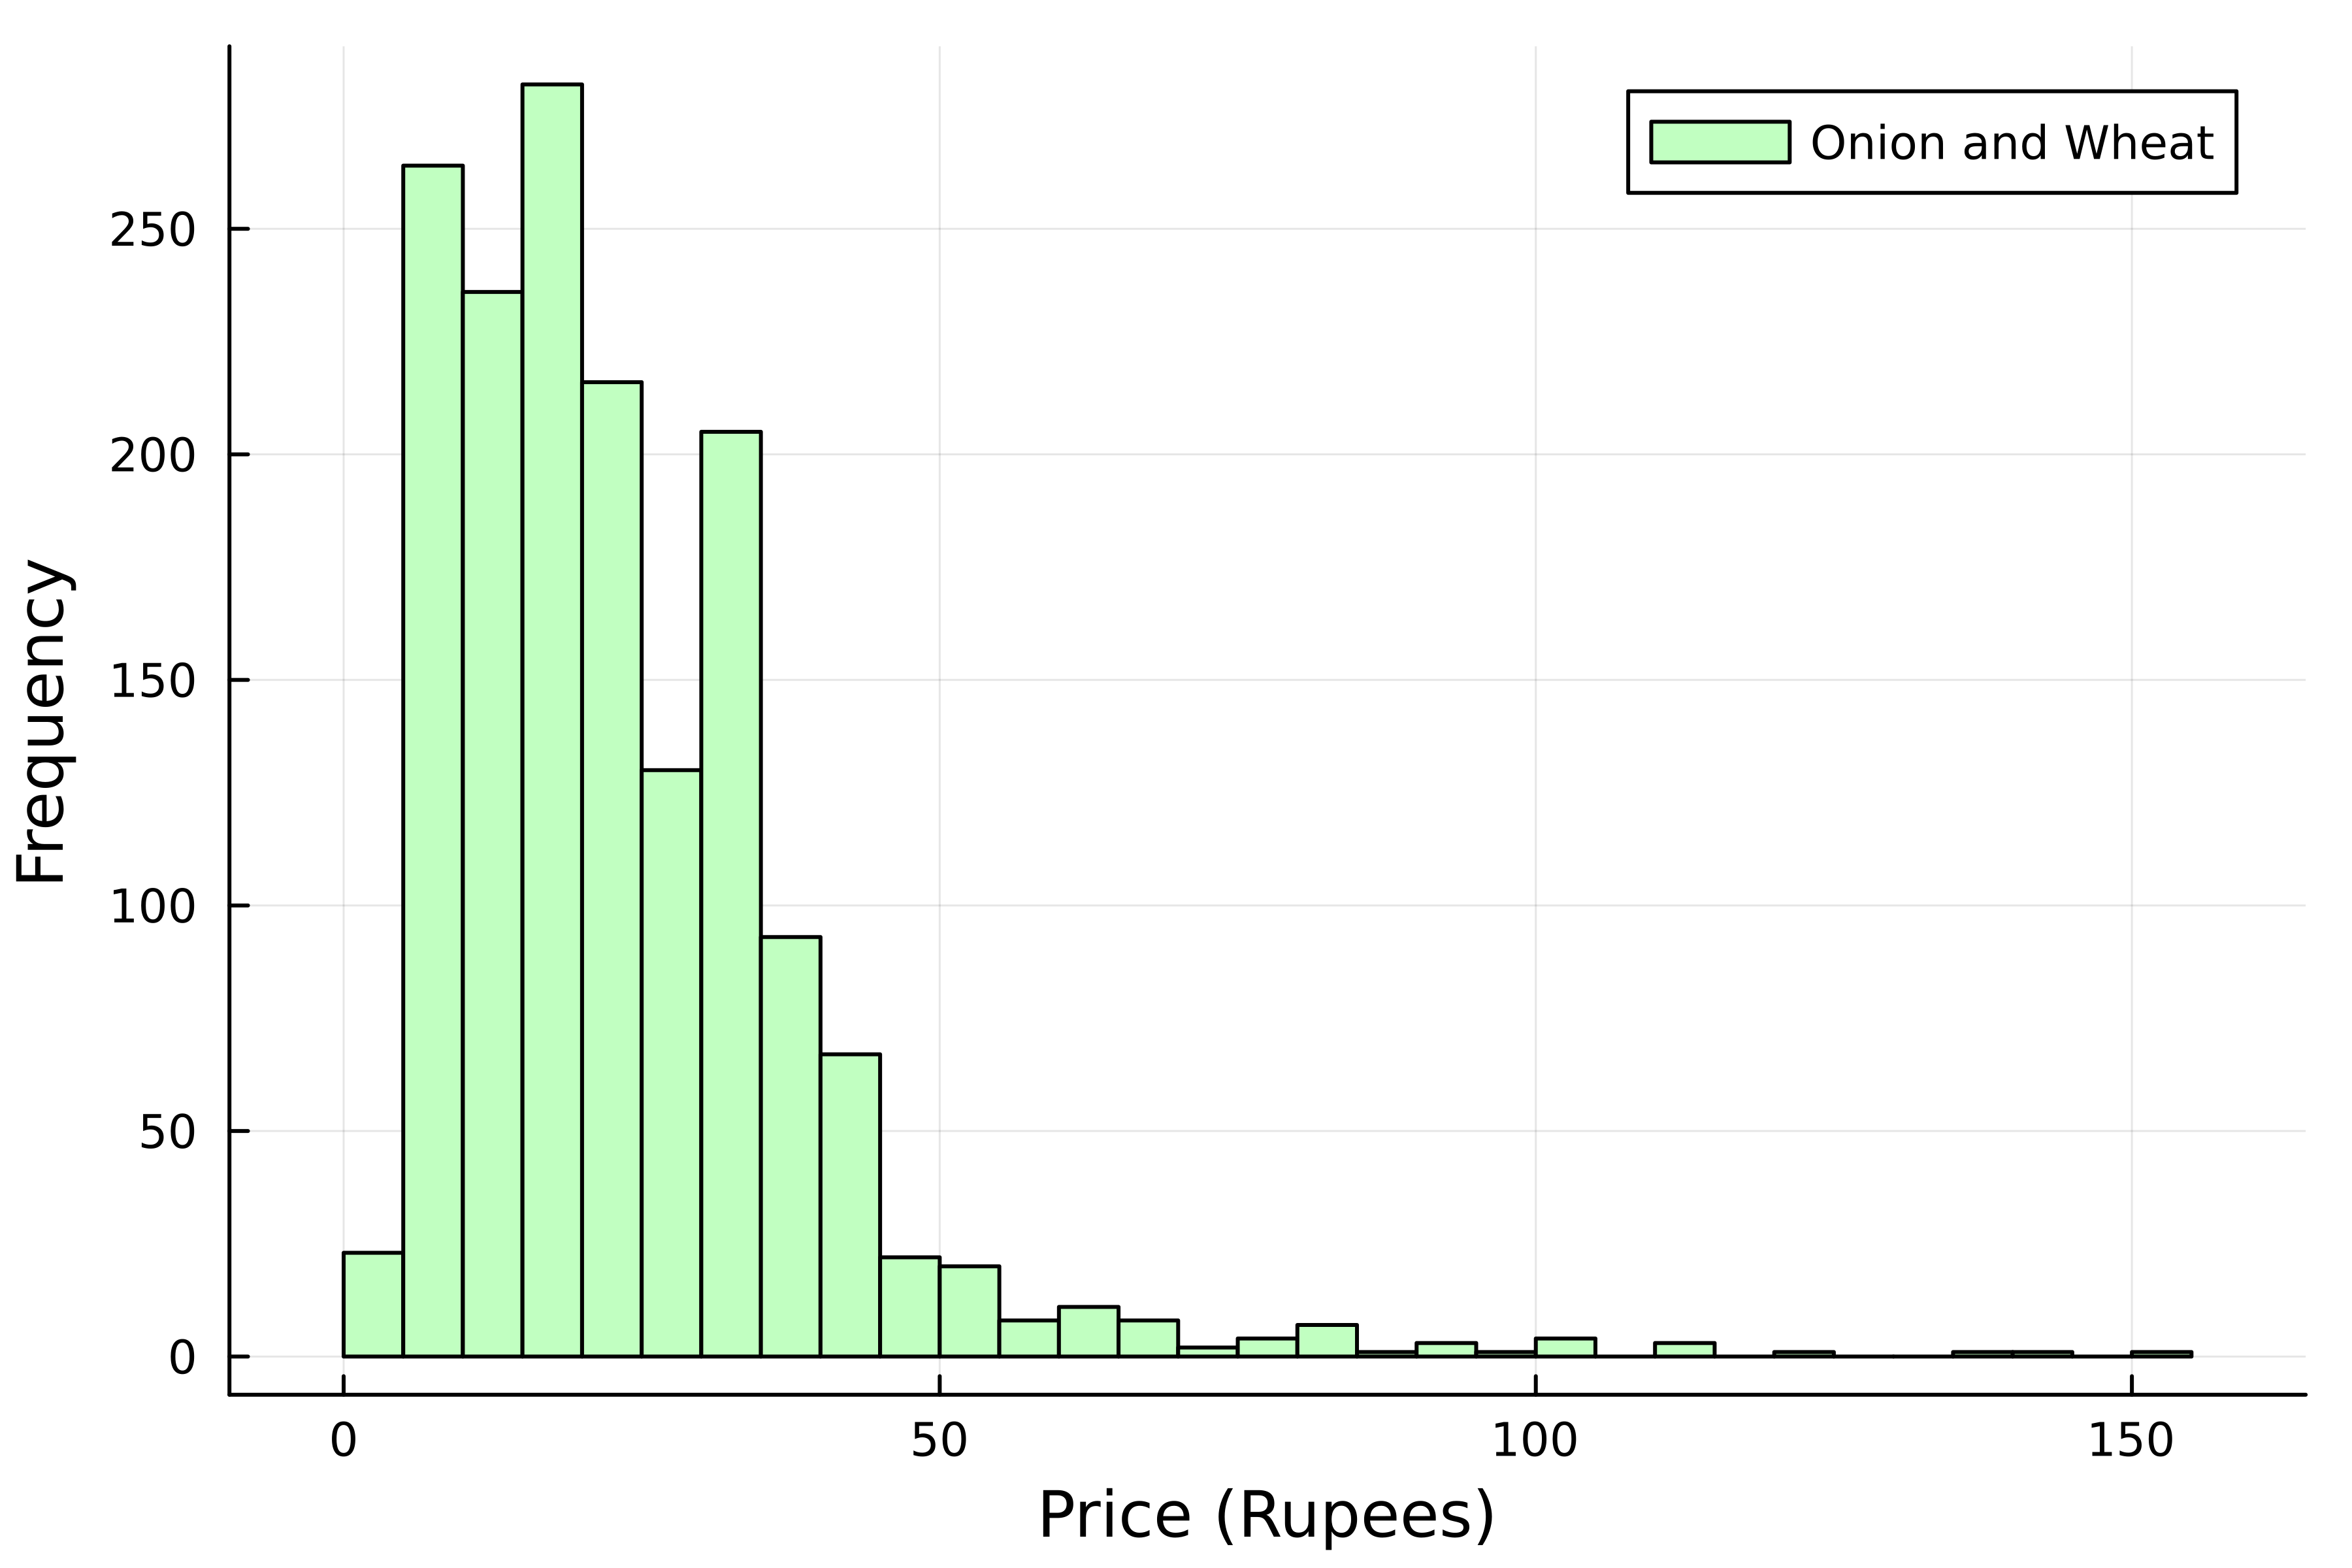
  • संख्यात्मक डेटा के वितरण

प्याज और गेहूं के दामों का वितरण दिखाता एक हिस्टोग्राम.

  • श्रेणियों की तुलना

भारत में अलग-अलग उत्पादों के औसत दाम दिखाता एक बार चार्ट.

Julia के साथ डेटा विज़ुअलाइज़ेशन परिचय

हमारा डेटासेट

Date State Centre Product Price
APR-2001 Andhra Pradesh Chittoor Bathing Soap 10.0
APR-2001 Andhra Pradesh Chittoor Ink 10.0
... ... ... ... ...
SEP-2016 Bihar Patna Paper 38.0
SEP-2016 Bihar Patna Toothpaste 50.0
  • औसत दाम (using Statistics)
# Group by each product
grouped = groupby(product, :Product)

# Calculate average prices mean_prices = combine( grouped, :Price => mean )
# Sort from higest to lowest sorted_mean_prices = sort( mean_prices, :Price_mean, rev=true )
Julia के साथ डेटा विज़ुअलाइज़ेशन परिचय

बार चार्ट बनाना

# Create bar chart
bar(
    # Categories in x-axis
    sorted_mean_prices.Product,
    # Values in y-axis
    sorted_mean_prices.Price_mean,

# Set bar width bar_width=0.5
label=false, color=:royalblue1, ) title!("Product Prices in India") ylabel!("Average Price (Rupees)")

भारत में अलग-अलग उत्पादों के औसत दाम दिखाता एक बार चार्ट.

Julia के साथ डेटा विज़ुअलाइज़ेशन परिचय

हॉरिज़ॉन्टल बार चार्ट्स

# Create bar chart
bar(
    # Values in the y-axis
    sorted_mean_prices.Product,
    # Values in x-axis
    sorted_mean_prices.Price_mean,

# Set orientation to horizontal permute=(:x, :y),
label=false, color=:royalblue1, ) title!("Product Prices in India") xlabel!("Average Price (Rupees)")

भारत में अलग-अलग उत्पादों के औसत दाम दिखाता एक क्षैतिज बार चार्ट.

Julia के साथ डेटा विज़ुअलाइज़ेशन परिचय

राज्य के अनुसार उत्पाद

  • चुने हुए राज्यों के लिए फ़िल्टर करें
filtered_product = filter(
    row -> row.State in ["Maharashtra", "Goa", "Gujarat"],
    product)
  • हर राज्य में प्रत्येक उत्पाद के औसत दाम
# Group by state and product
filtered_grouped = groupby(filtered_product, [:State, :Product])

# Calculate average prices filtered_mean_prices = combine( filtered_grouped, :Price => mean )
Julia के साथ डेटा विज़ुअलाइज़ेशन परिचय

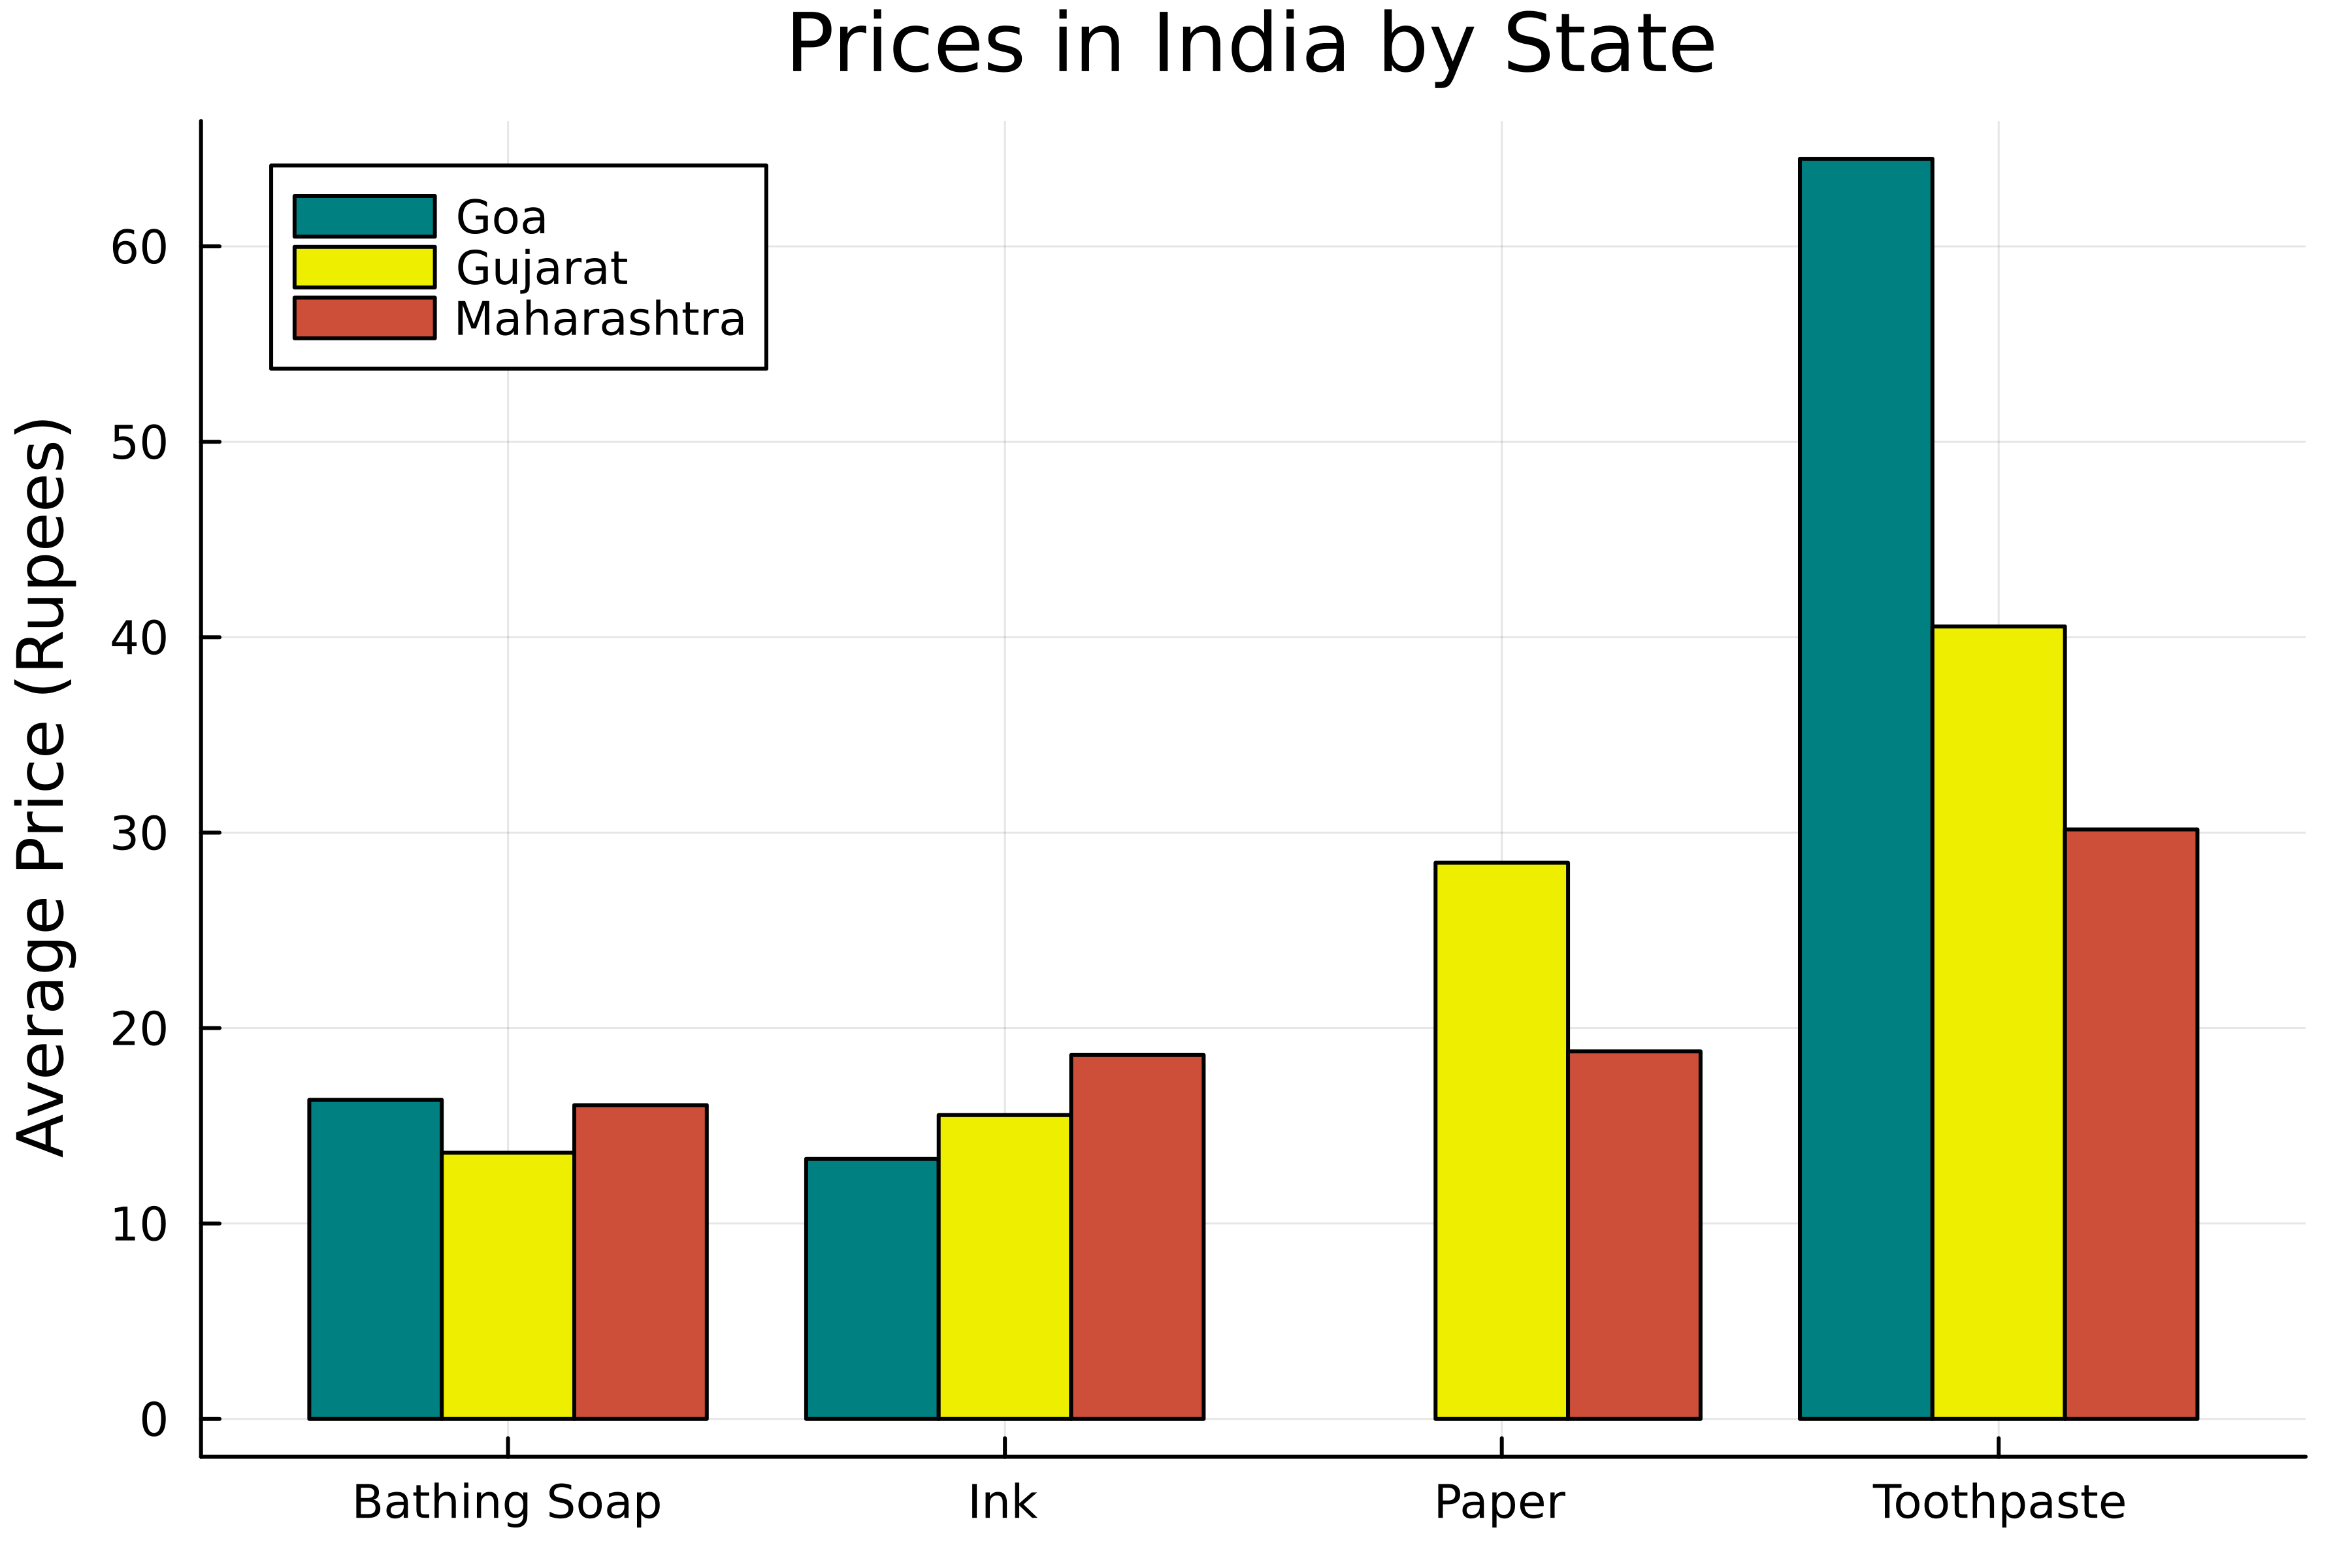
ग्रुप्ड बार चार्ट्स

# Create grouped bar chart
groupedbar(
    # Categories in x-axis
    filtered_mean_prices.Commodity,
    # Values in y-axis
    filtered_mean_prices.Price_mean,

# Define groups group=filtered_mean_prices.State,
color=[:teal :yellow2 :tomato3] ) title!("Prices in India by State") ylabel!("Average Price (Rupees)")

भारत में कुछ उत्पादों के दाम, राज्य के अनुसार समूहित, साथ-साथ बार्स के रूप में दिखाता चार्ट.

Julia के साथ डेटा विज़ुअलाइज़ेशन परिचय

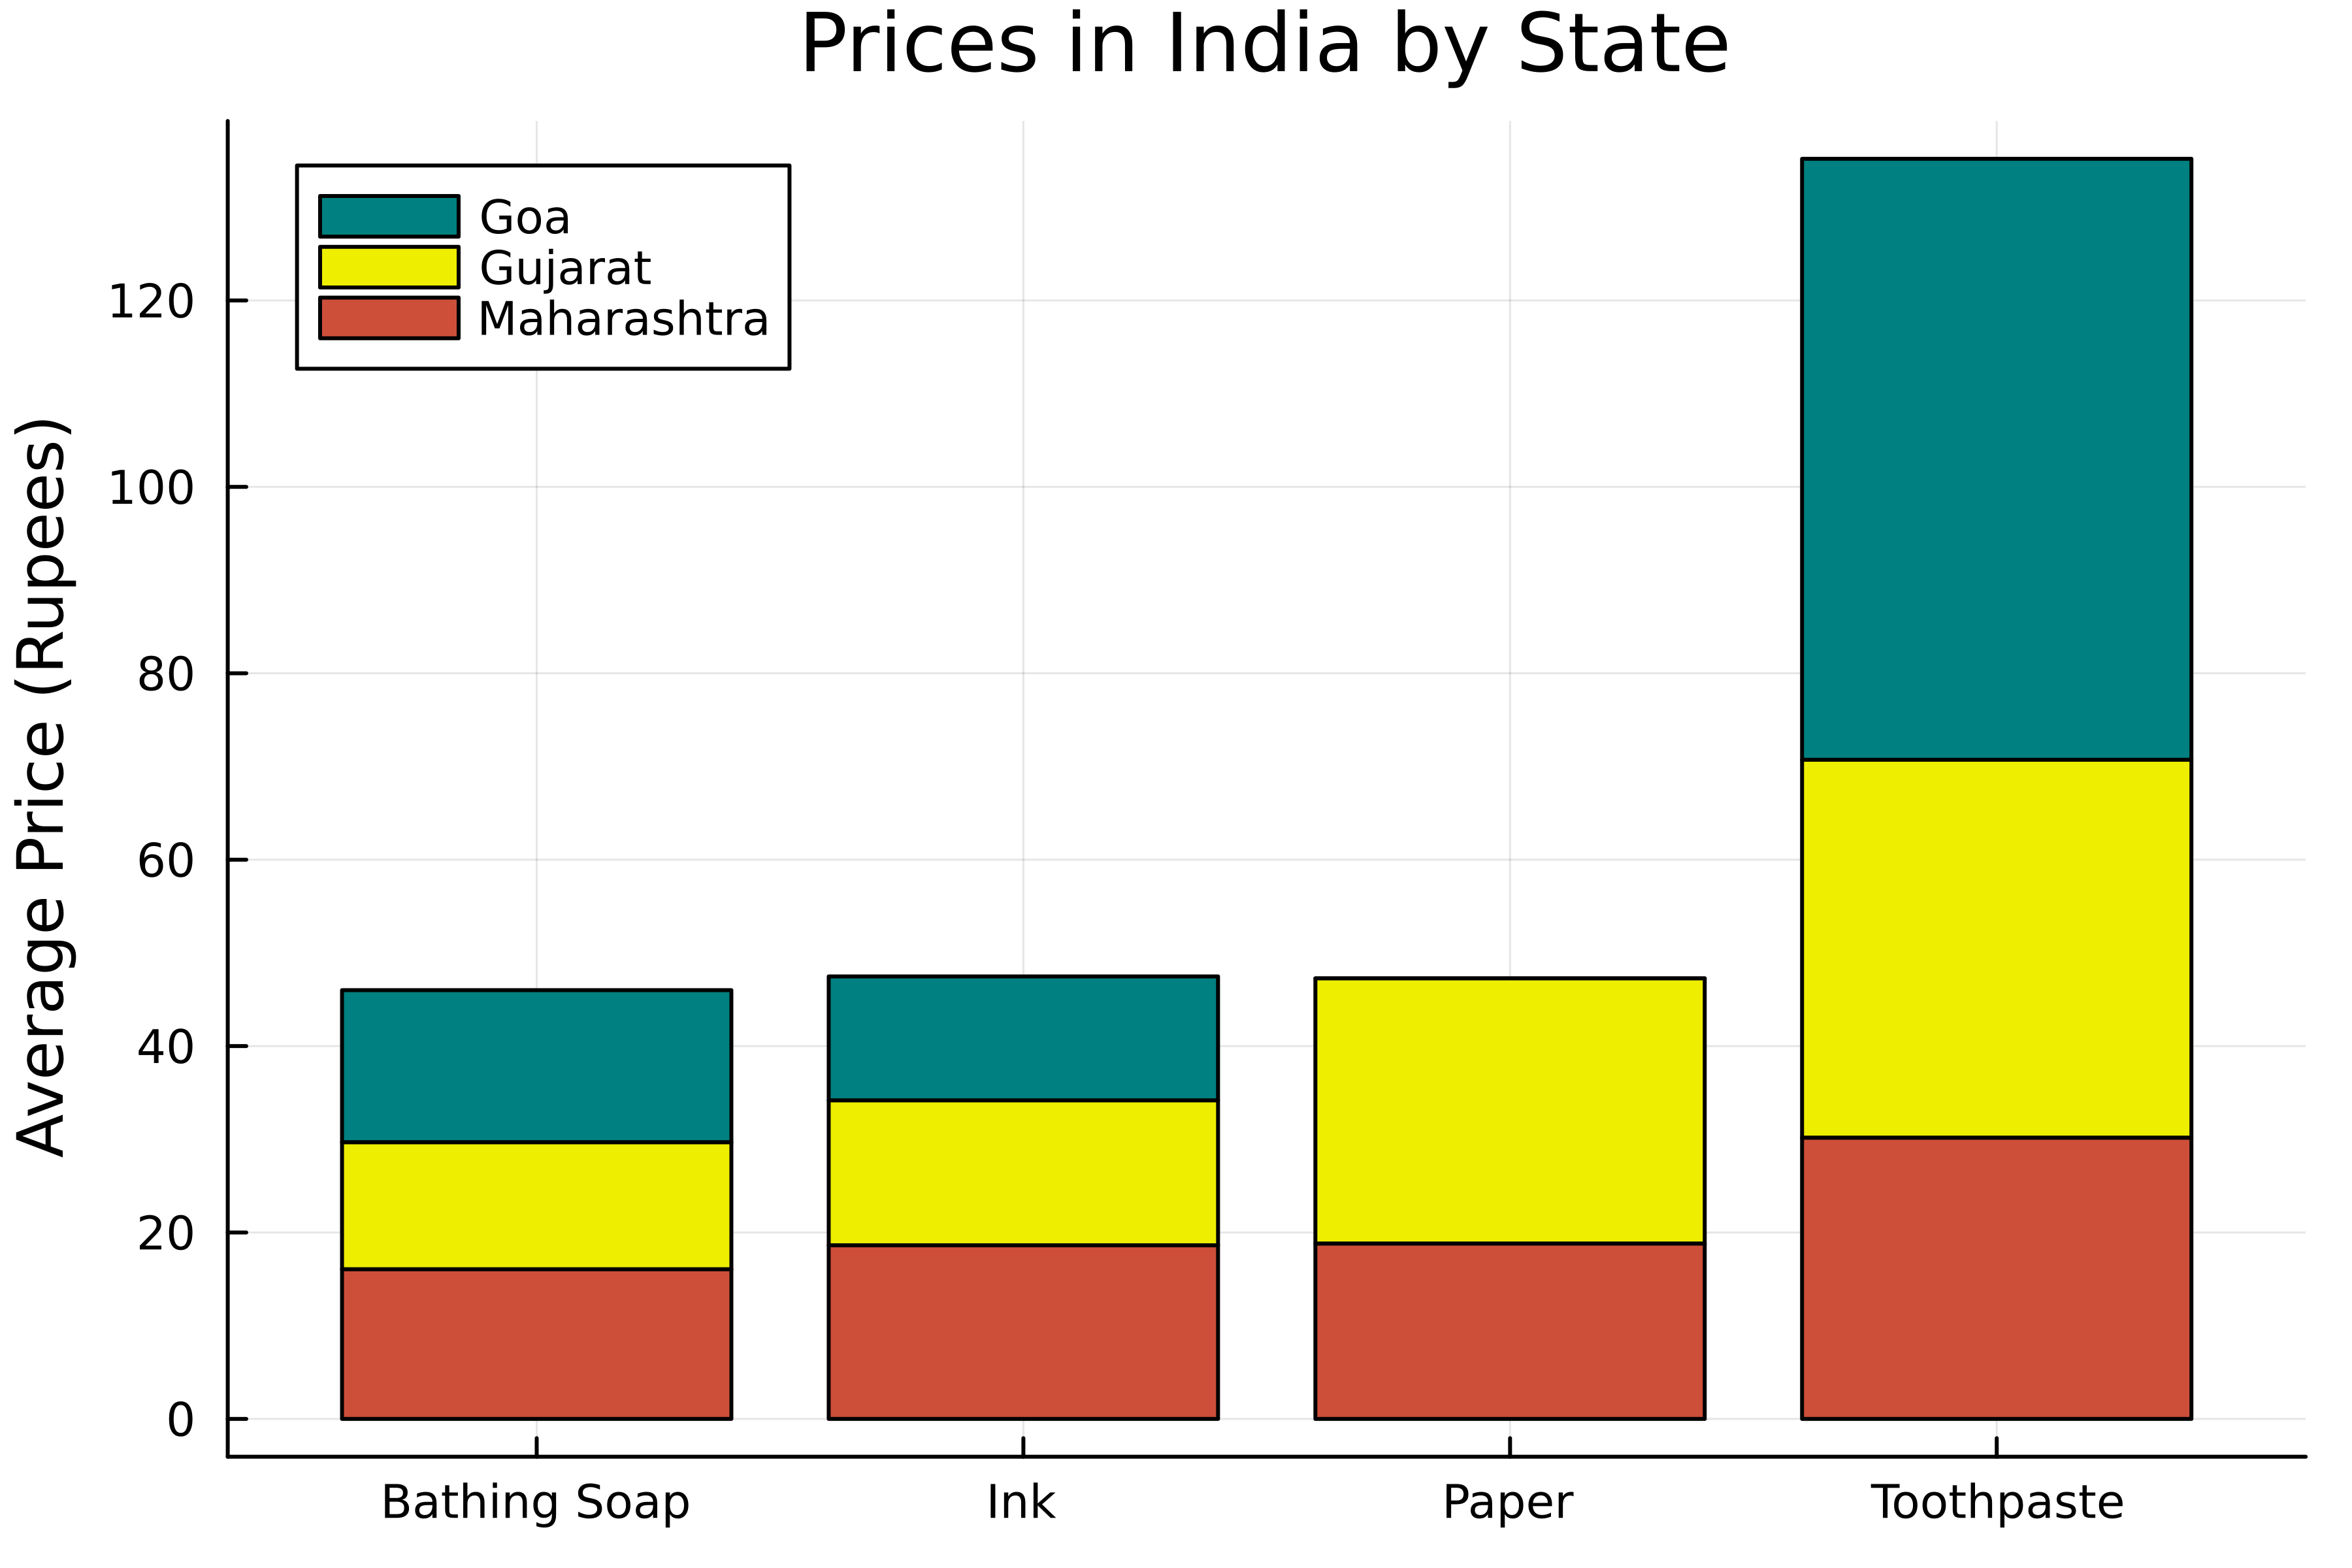
बार्स को स्टैक करें

# Create grouped bar chart
groupedbar(
    # Categories in x-axis
    filtered_mean_prices.Commodity,
    # Values in y-axis
    filtered_mean_prices.Price_mean, 
    # Define groups
    group=filtered_mean_prices.State,
    color=[:teal :snow2 :tomato3],

# Stack the bars bar_position=:stack
) title!("Product Prices in India by State") ylabel!("Average Price (Rupees)")

भारत में कुछ उत्पादों के दाम, राज्य के अनुसार समूहित, स्टैक्ड बार्स के रूप में दिखाता चार्ट.

Julia के साथ डेटा विज़ुअलाइज़ेशन परिचय

अभ्यास करते हैं!

Julia के साथ डेटा विज़ुअलाइज़ेशन परिचय

Preparing Video For Download...