flexmix के साथ यूनिवेरिएट Gaussian मिक्सचर मॉडल्स

R में Mixture Models

Victor Medina

Researcher at The University of Edinburgh

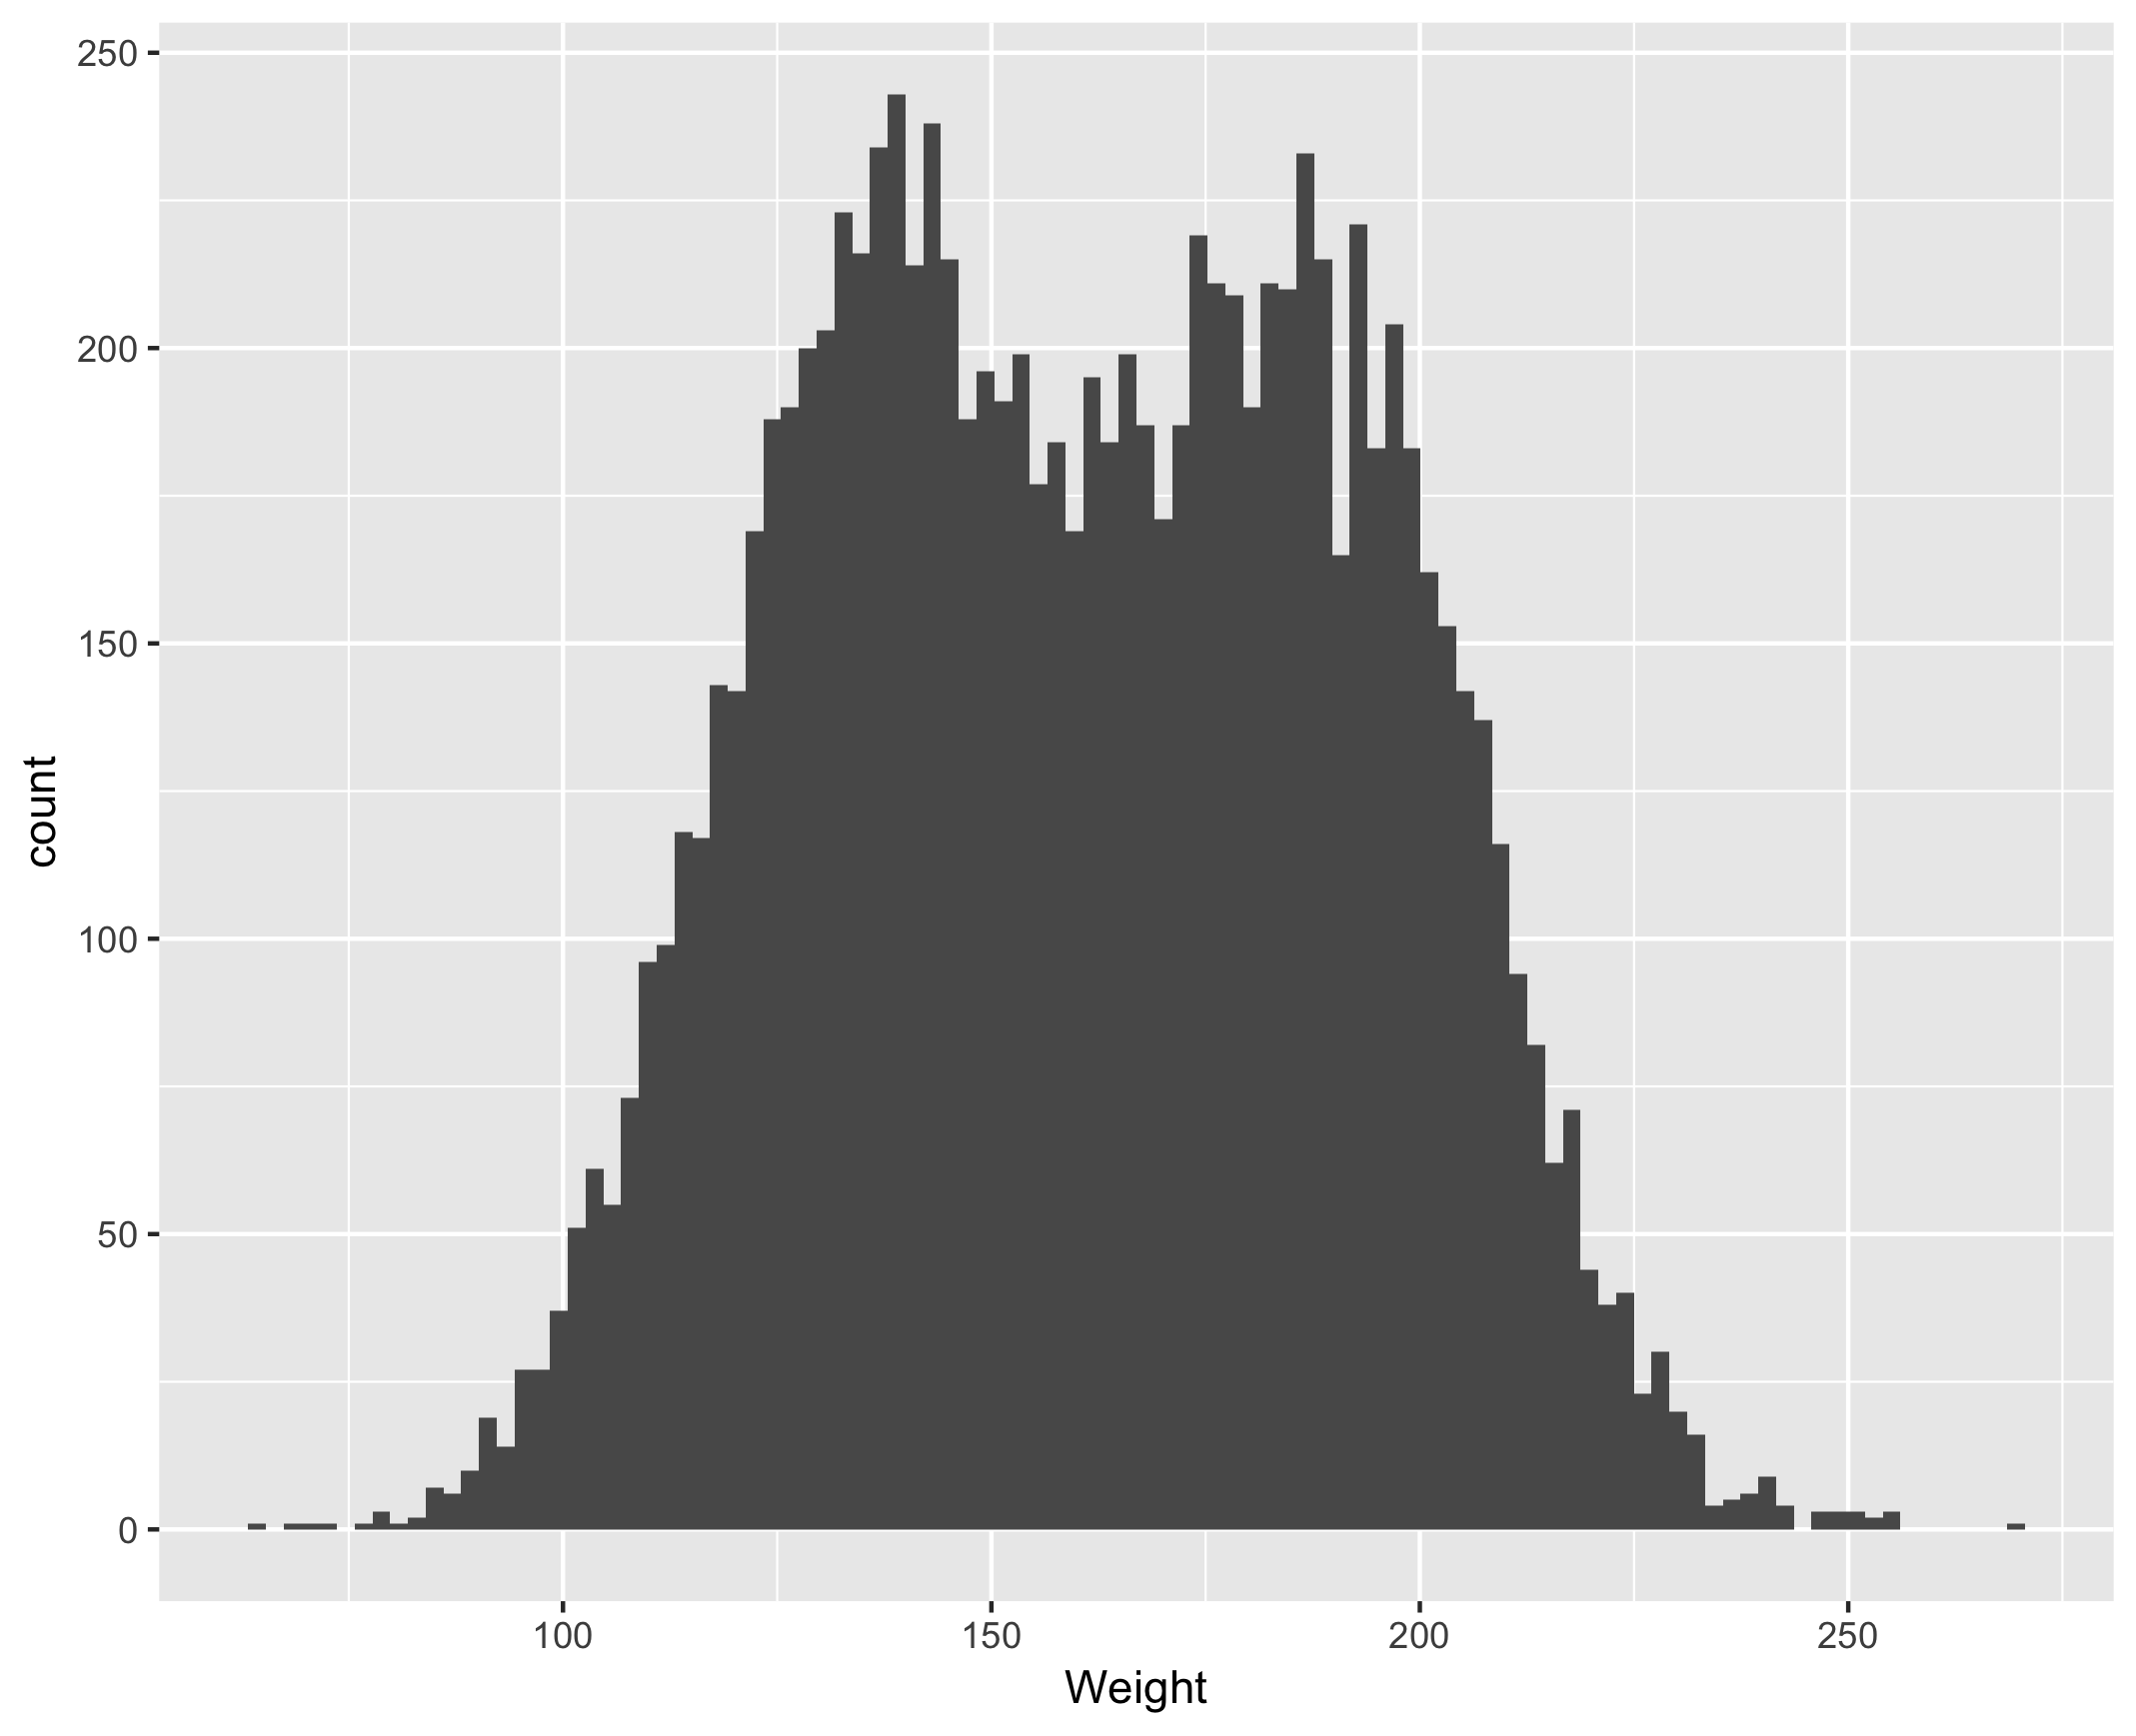
gender %>% 
  ggplot(aes(x = Weight)) + geom_histogram(bins = 100)
R में Mixture Models

Mixture models के साथ मॉडलिंग

  1. उपयुक्त probability distribution कौन-सा है?
    • यूनिवेरिएट Gaussian distributions
  2. हमें कितनी sub-populations माननी चाहिए?
    • 2 clusters
  3. पैरामीटर्स और उनके अनुमान क्या हैं?
    • means, standard deviations और proportions के लिए flexmix में लागू EM algorithm
R में Mixture Models

flexmix फंक्शन

flexmix(formula, data, k, model, control, ...)

  • formula: fit होने वाले मॉडल का विवरण ($variable \sim 1$)
  • data: data frame
  • k: clusters की संख्या
  • model: distribution निर्दिष्ट करता है (FLXMCnorm1, FLXMCmvnorm, FLXMCmvbinary, FLXMRglm, FLXMCmvpois)
  • control: max iterations, tolerance आदि निर्दिष्ट करता है
R में Mixture Models
fit_mixture <- flexmix(Weight ~ 1, # the means and sds are constant
                data = gender, # the data frame
                k = 2, # the number of clusters,
                model = FLXMCnorm1(), # univariate Gaussian    
                control = list(tol = 1e-15, # tolerance for EM stop
                               verbose = 1, # show partial results
                               iter = 1e4)) # max number of iterations
Classification: weighted 
   1 Log-likelihood :  -48880.0782 
   2 Log-likelihood :  -48880.0745 
   3 Log-likelihood :  -48880.0732 
   4 Log-likelihood :  -48880.0727
   .    .   .   .   .   .   .   .
3454 Log-likelihood :  -48518.3717 
3455 Log-likelihood :  -48518.3717 
3456 Log-likelihood :  -48518.3717 
3457 Log-likelihood :  -48518.3717 
converged
R में Mixture Models

Proportions: prior फंक्शन

proportions <- prior(fit_mixture)
proportions
0.4929668 0.5070332
R में Mixture Models

दोनों distributions

parameters(fit_mixture)
                    Comp.1    Comp.2
coef.(Intercept) 135.54652 186.61583
sigma             18.94726  19.96097

प्रत्येक का अलग-अलग

comp_1 <- parameters(fit_mixture, component = 1)
comp_2 <- parameters(fit_mixture, component = 2)
comp_2
                    Comp.2
coef.(Intercept) 186.61583
sigma             19.96097
R में Mixture Models

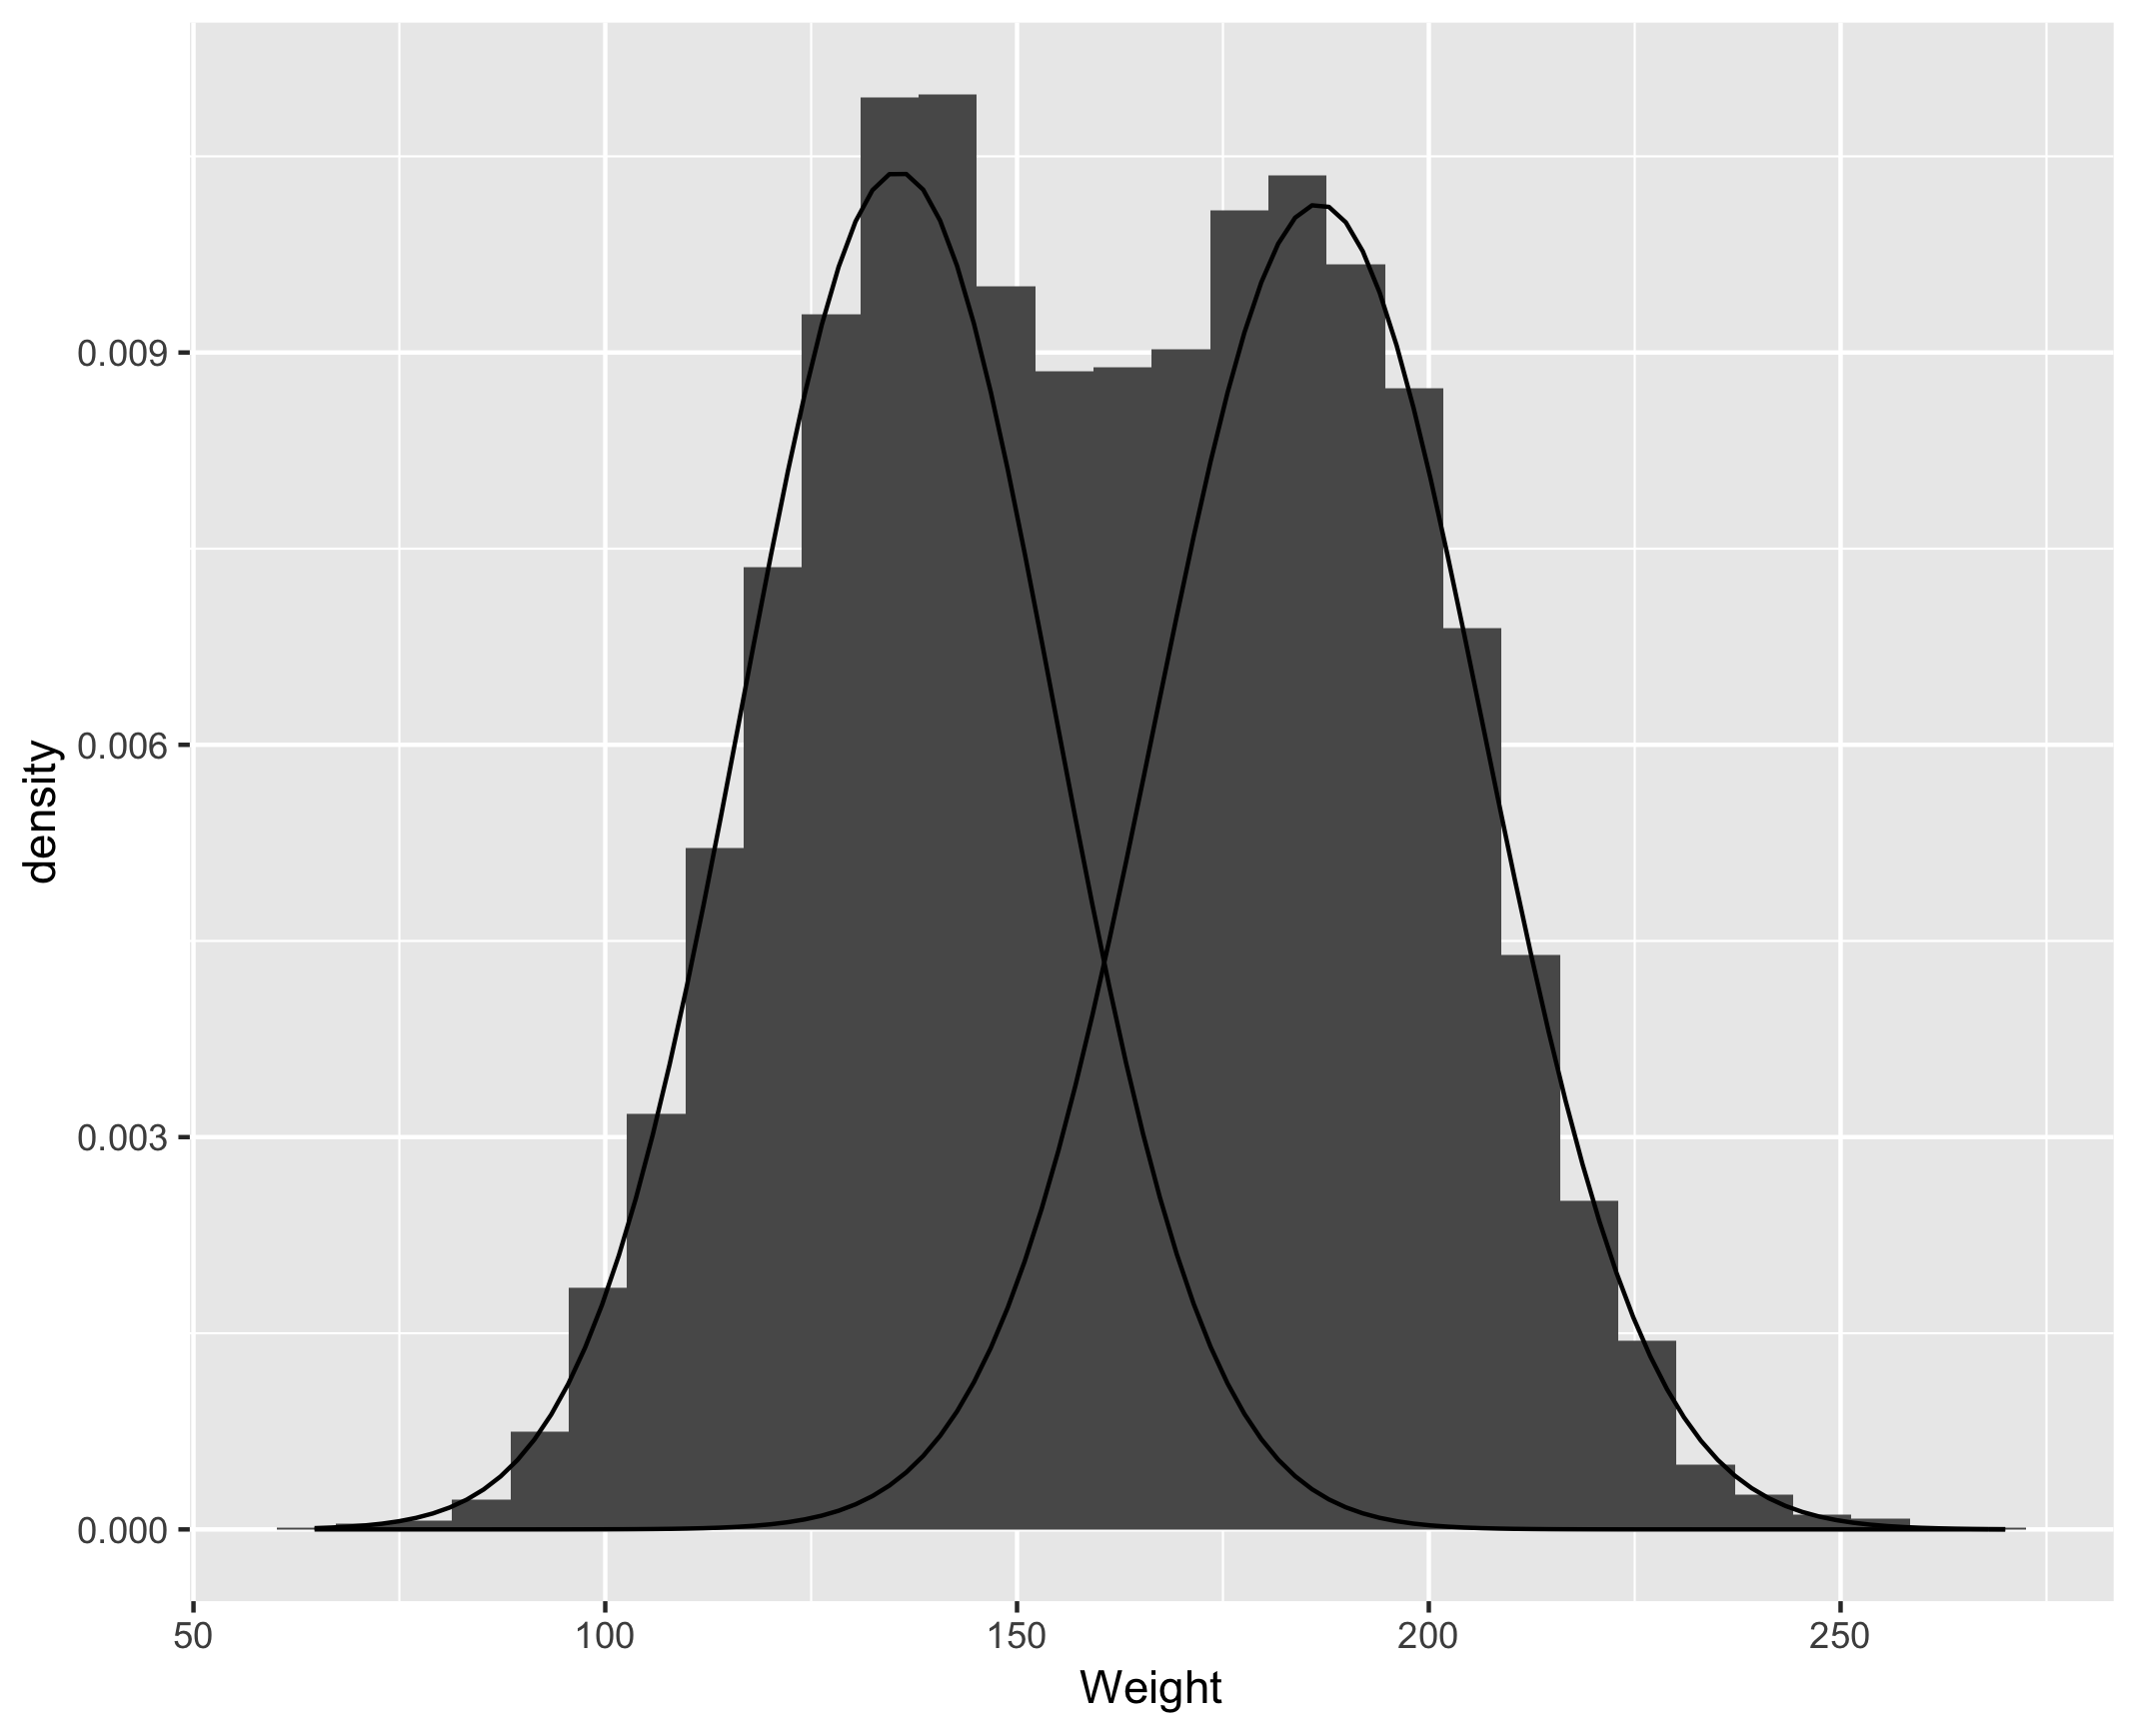
परिणामी distributions को विज़ुअलाइज़ करें

gender %>%
   ggplot() + geom_histogram(aes(x = Weight, y = ..density..)) + 
   stat_function(geom = "line", fun = fun_prop, 
                 args = list(mean = comp_1[1], 
                             sd = comp_1[2], 
                             proportion = proportions[1])) +
   stat_function(geom = "line", fun = fun_prop, 
                 args = list(mean = comp_2[1], 
                             sd = comp_2[2], 
                             proportion = proportions[2]))
R में Mixture Models

R में Mixture Models

posterior फंक्शन

posterior(fit_mixture) %>% head()
             [,1]      [,2]
[1,] 6.836341e-06 0.9999932
[2,] 4.421760e-01 0.5578240
[3,] 5.994160e-04 0.9994006
[4,] 1.998798e-04 0.9998001
[5,] 1.547774e-03 0.9984522
[6,] 7.544450e-01 0.2455550

clusters फंक्शन

clusters(fit_mixture) %>% head()
2 2 2 2 2 1
R में Mixture Models

Assignments तुलना

table(gender$Gender, clusters(fit_mixture))
            1    2
  Female 4500  500
  Male    444 4556
R में Mixture Models

अभ्यास करते हैं!

R में Mixture Models

Preparing Video For Download...