Subplots

Bokeh के साथ इंटरएक्टिव डेटा विज़ुअलाइज़ेशन

George Boorman

Core Curriculum Manager, DataCamp

Subplots क्यों?
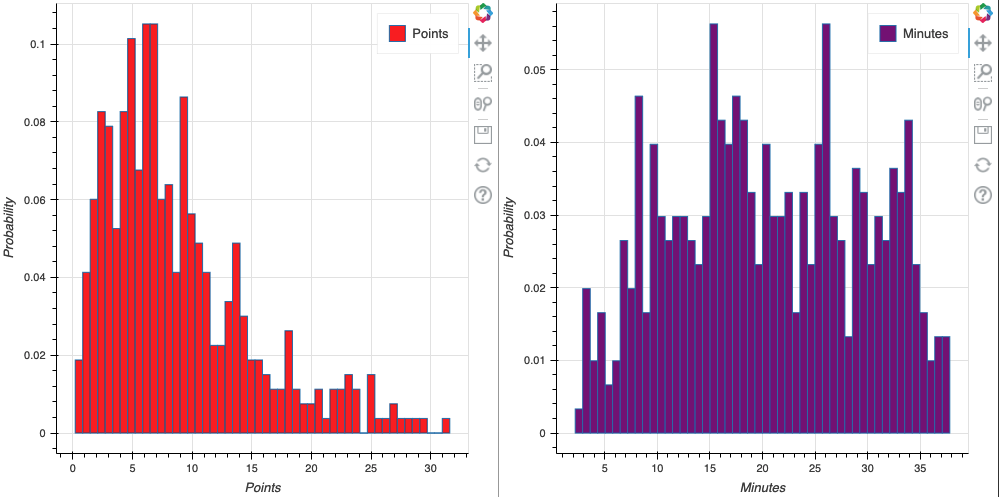
हिस्टोग्राम

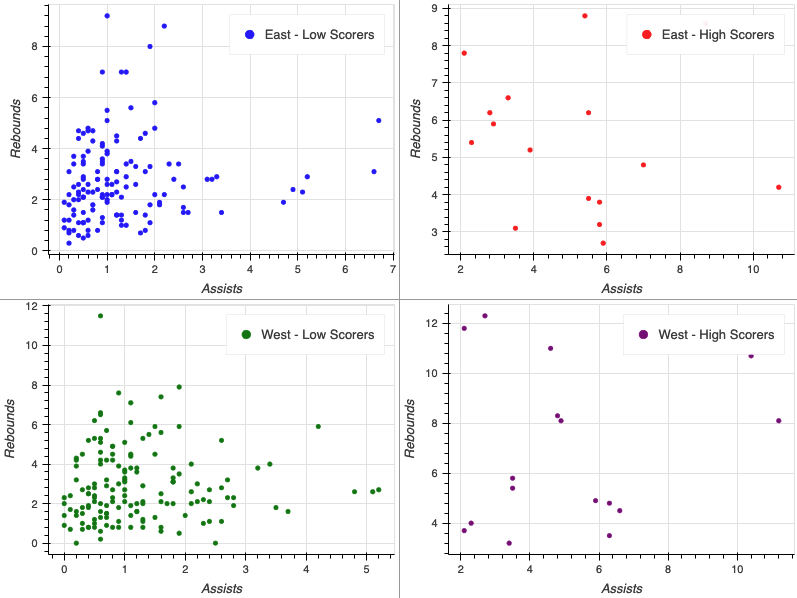
हाई बनाम लो रो सबप्लॉट

Bokeh के साथ इंटरएक्टिव डेटा विज़ुअलाइज़ेशन

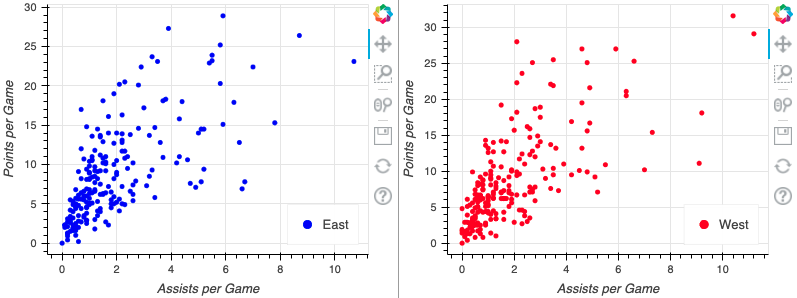
Row बनाना

from bokeh.layouts import row

east_source = ColumnDataSource(data=east) west_source = ColumnDataSource(data=west) fig_one = figure(x_axis_label="Assists per Game", y_axis_label="Points per Game") fig_two = figure(x_axis_label="Assists per Game", y_axis_label="Points per Game")
fig_one.circle(x="assists", y="points", source=east_source, color="blue", legend_label="East") fig_two.circle(x="assists", y="points", source=west_source, color="blue", legend_label="West")
output_file(filename="row_plots.html")
show(row(fig_one, fig_two))
Bokeh के साथ इंटरएक्टिव डेटा विज़ुअलाइज़ेशन

Row सबप्लॉट

NBA सबप्लॉट

Bokeh के साथ इंटरएक्टिव डेटा विज़ुअलाइज़ेशन

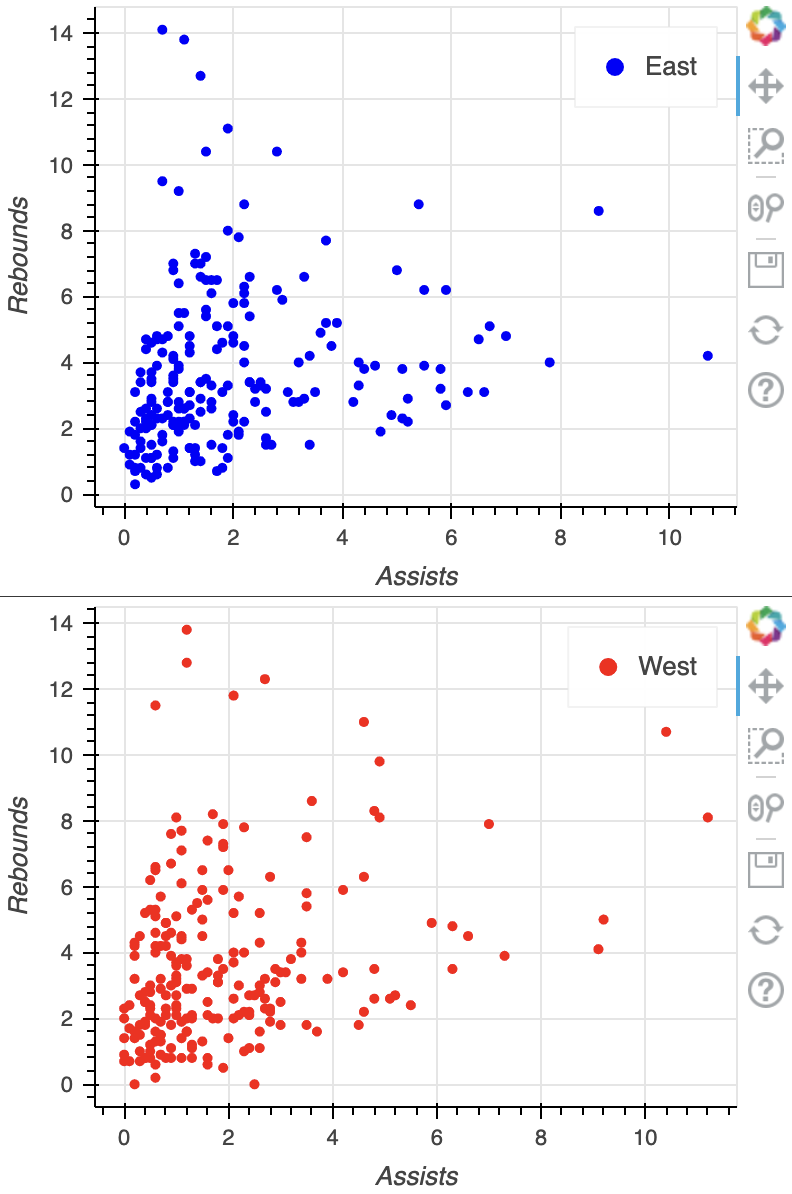
Column सबप्लॉट

from bokeh.layouts import column

fig_one = figure(x_axis_label="Assists", y_axis_label="Rebounds") fig_two = figure(x_axis_label="Assists", y_axis_label="Rebounds") fig_one.circle(x="assists", y="rebounds", source=east_source, color="blue", legend_label="East") fig_two.circle(x="assists", y="rebounds", source=east_source, color="blue", legend_label="East")
output_file(filename="column_plots.html") show(column(fig_one, fig_two))

बेसिक कॉलम प्लॉट

Bokeh के साथ इंटरएक्टिव डेटा विज़ुअलाइज़ेशन

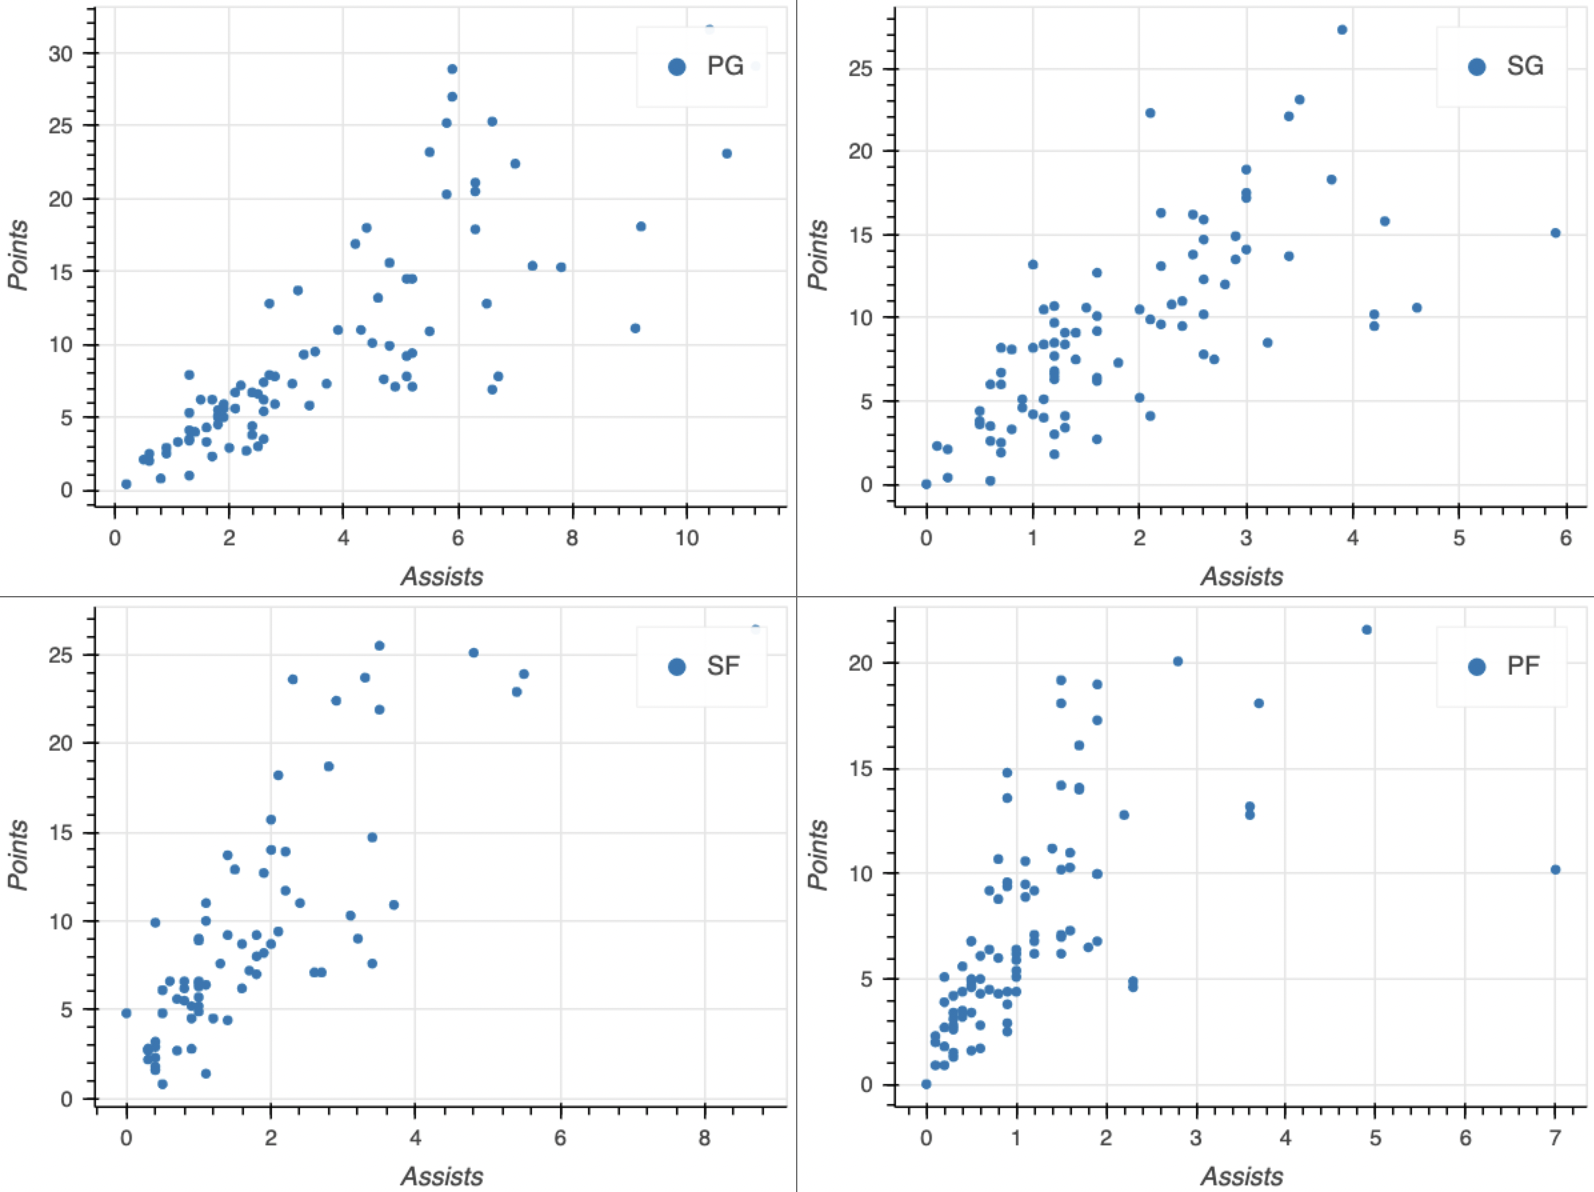
Gridplot बनाना

from bokeh.layouts import gridplot

positions = ["PG", "SG", "SF", "PF"]
plots = []
for position in positions:
nba_positions = nba.loc[nba["position"] == position] source = ColumnDataSource(data=nba_positions)
fig = figure(x_axis_label="Assists", y_axis_label="Points")
fig.circle(x="assists", y="points", source=source, legend_label=position)
plots.append(fig)
output_file(filename="nba_gridplot.html") show(gridplot(plots, ncols=2))
Bokeh के साथ इंटरएक्टिव डेटा विज़ुअलाइज़ेशन

Gridplot

ग्रिडप्लॉट

Bokeh के साथ इंटरएक्टिव डेटा विज़ुअलाइज़ेशन

Figure साइज़ कस्टमाइज़ करना

fig = figure(x_axis_label="Assists", y_axis_label="Rebounds",

width=750, height=300)
fig.circle(x="assists", y="rebounds", source=source) output_file(filename="custom_size_plot.html") show(fig)
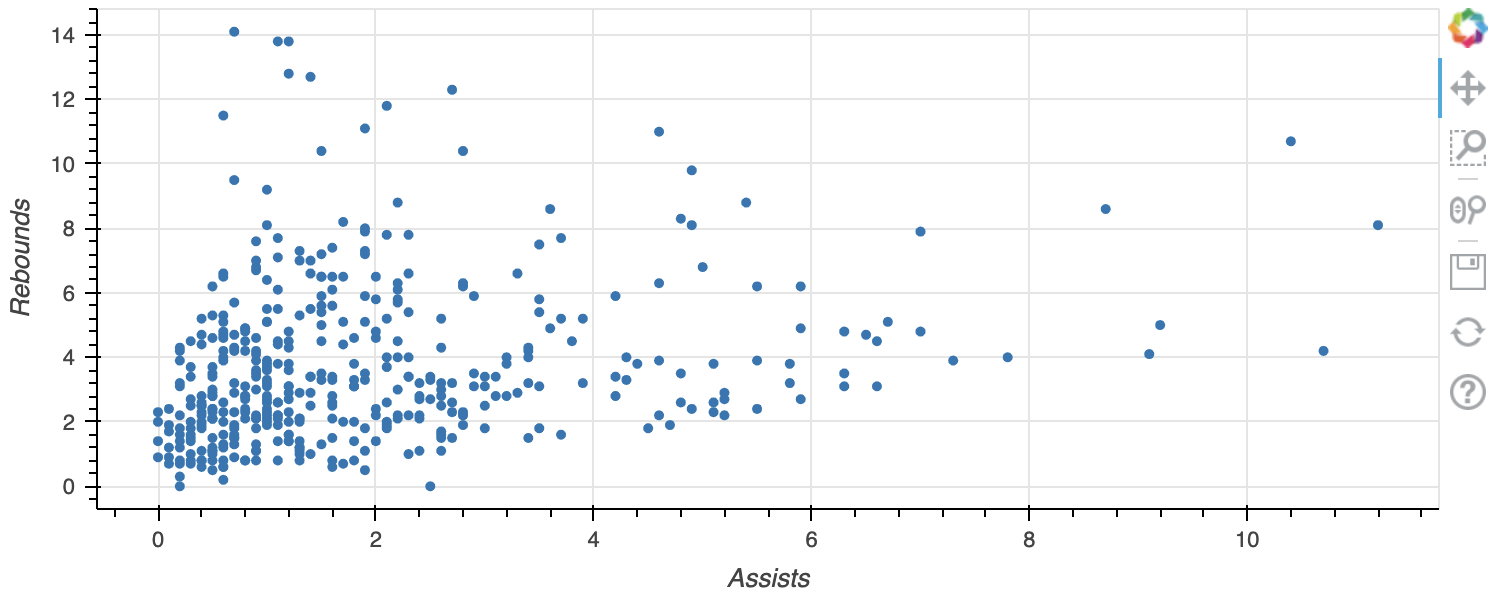
कस्टम साइज़ प्लॉट

Bokeh के साथ इंटरएक्टिव डेटा विज़ुअलाइज़ेशन

अभ्यास करते हैं!

Bokeh के साथ इंटरएक्टिव डेटा विज़ुअलाइज़ेशन

Preparing Video For Download...