लाभ मापना
R में पैरेलल प्रोग्रामिंग

Nabeel Imam
Data Scientist
टॉय उदाहरण
numbers <- 1:1000000# Sequential sqroots <- lapply(numbers, sqrt)# Parallel cl <- makeCluster(4) sqroots <- parLapply(cl, numbers, sqrt) stopCluster(my_cluster)
कौन बेहतर चलेगा?
परफॉरमेंस benchmarking
औसत execution time आँकने के लिए कोड कई बार चलाएँ
library(microbenchmark)microbenchmark( "Sequential" = lapply(numbers, sqrt),"Parallel" = { cl <- makeCluster(4) parLapply(cl, numbers, sqrt) stopCluster(my_cluster) },times = 10 )
Unit: milliseconds
      expr     min    mean     max neval
Sequential  633.96  838.09  993.59    10
  Parallel 1136.95 1247.29 1557.58    10
- साधारण संख्यात्मक operations को parallelization से शायद ही लाभ मिलता है
- Profiling लाइन-दर-लाइन बताता है, benchmarking कुल execution time देता है
स्पष्ट मगर अनदेखी बात
sqroots <- sqrt(numbers)

Vectorization
sqroots <- sqrt(numbers)
- Base R फंक्शन, जैसे
sqrt(), vectorized होते हैं. - एक ही फंक्शन को कई इनपुट पर map करें
- बहुत तेज, पर सिर्फ सरल operations पर लागू
microbenchmark(
  "Vectorized" = sqrt(numbers),
  "Sequential" = lapply(numbers, sqrt),
  "Parallel" = {
    cl <- makeCluster(4)
    parLapply(cl, numbers, sqrt)
    stopCluster(my_cluster)
  },
  times = 10)
Unit: milliseconds
      expr       min      mean      max neval
Vectorized    2.3904    9.2071   66.303    10
Sequential  352.1166  771.7491 1004.753    10
  Parallel 1191.3176 1377.6926 1700.316    10
Bootstrap
मौजूदा डेटा से replacement के साथ sampling
print(ls_df)
$`2001`
   Country             Life_expectancy  Year
 1 Afghanistan                    56.3  2001
 2 Albania                        74.3  2001
 3 Algeria                        71.1  2001
...
$`2002`
   Country             Life_expectancy  Year
 1 Afghanistan                    56.8  2002
 2 Albania                        74.6  2002
 3 Algeria                        71.6  2002
...
क्लासिक संस्करण
df <- ls_df$`2001`estimates <- rep(0, 10000)for (i in 1:10000) { b <- sample(df$Life_expectancy, replace = T)estimates[i] <- mean(b) }
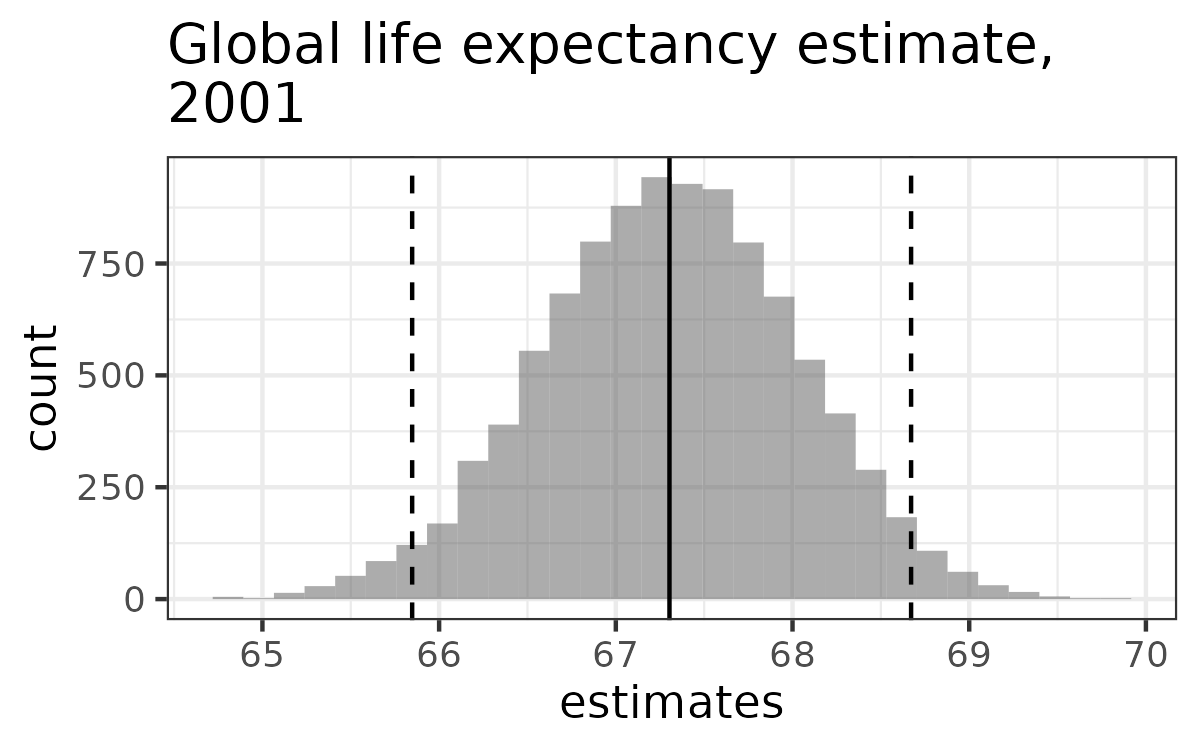
- Quantiles से confidence interval:
quantile(estimates, c(0.025, 0.975))
अच्छी खबर
Bootstraps को parallelize किया जा सकता है
estimates <- rep(0, 10000)

for (i in 1:10000) {

  b <- sample(df$Life_expectancy,
              replace = T)

  estimates[i] <- mean(b)
  }
boot_dist <- function (df) { estimates <- rep(0, 10000) for (i in 1:10000) { b <- sample(df$Life_expectancy, replace = T) estimates[i] <- mean(b) } return(estimates) }cl <- makeCluster(4) ls_dists <- parLapply(cl, ls_df, boot_dist) stopCluster(cl)
लाभ
microbenchmark(
  "lapply" = lapply(ls_df, boot_dist),
  "parLapply" = {
    cl <- makeCluster(4)
    parLapply(cl, ls_df, boot_dist)
    stopCluster(cl)
  },
  times = 10
)
Unit: seconds
     expr    min   mean    max neval
   lapply 3.6938 4.2184 4.5267    10
parLapply 1.9006 2.5166 2.7292    10
कैसे पहुँचे:
- मौजूदा कोड प्रोफाइल करें, सबसे धीमा भाग पहचानें
- उसी स्टेप को parallelize/optimize करें
- Benchmark करें और तुलना करें
अभ्यास करते हैं!
R में पैरेलल प्रोग्रामिंग

