लेयर्स जोड़ना

इंटरमीडिएट इंटरएक्टिव डेटा विज़ुअलाइज़ेशन with plotly in R

Adam Loy

Statistician, Carleton College
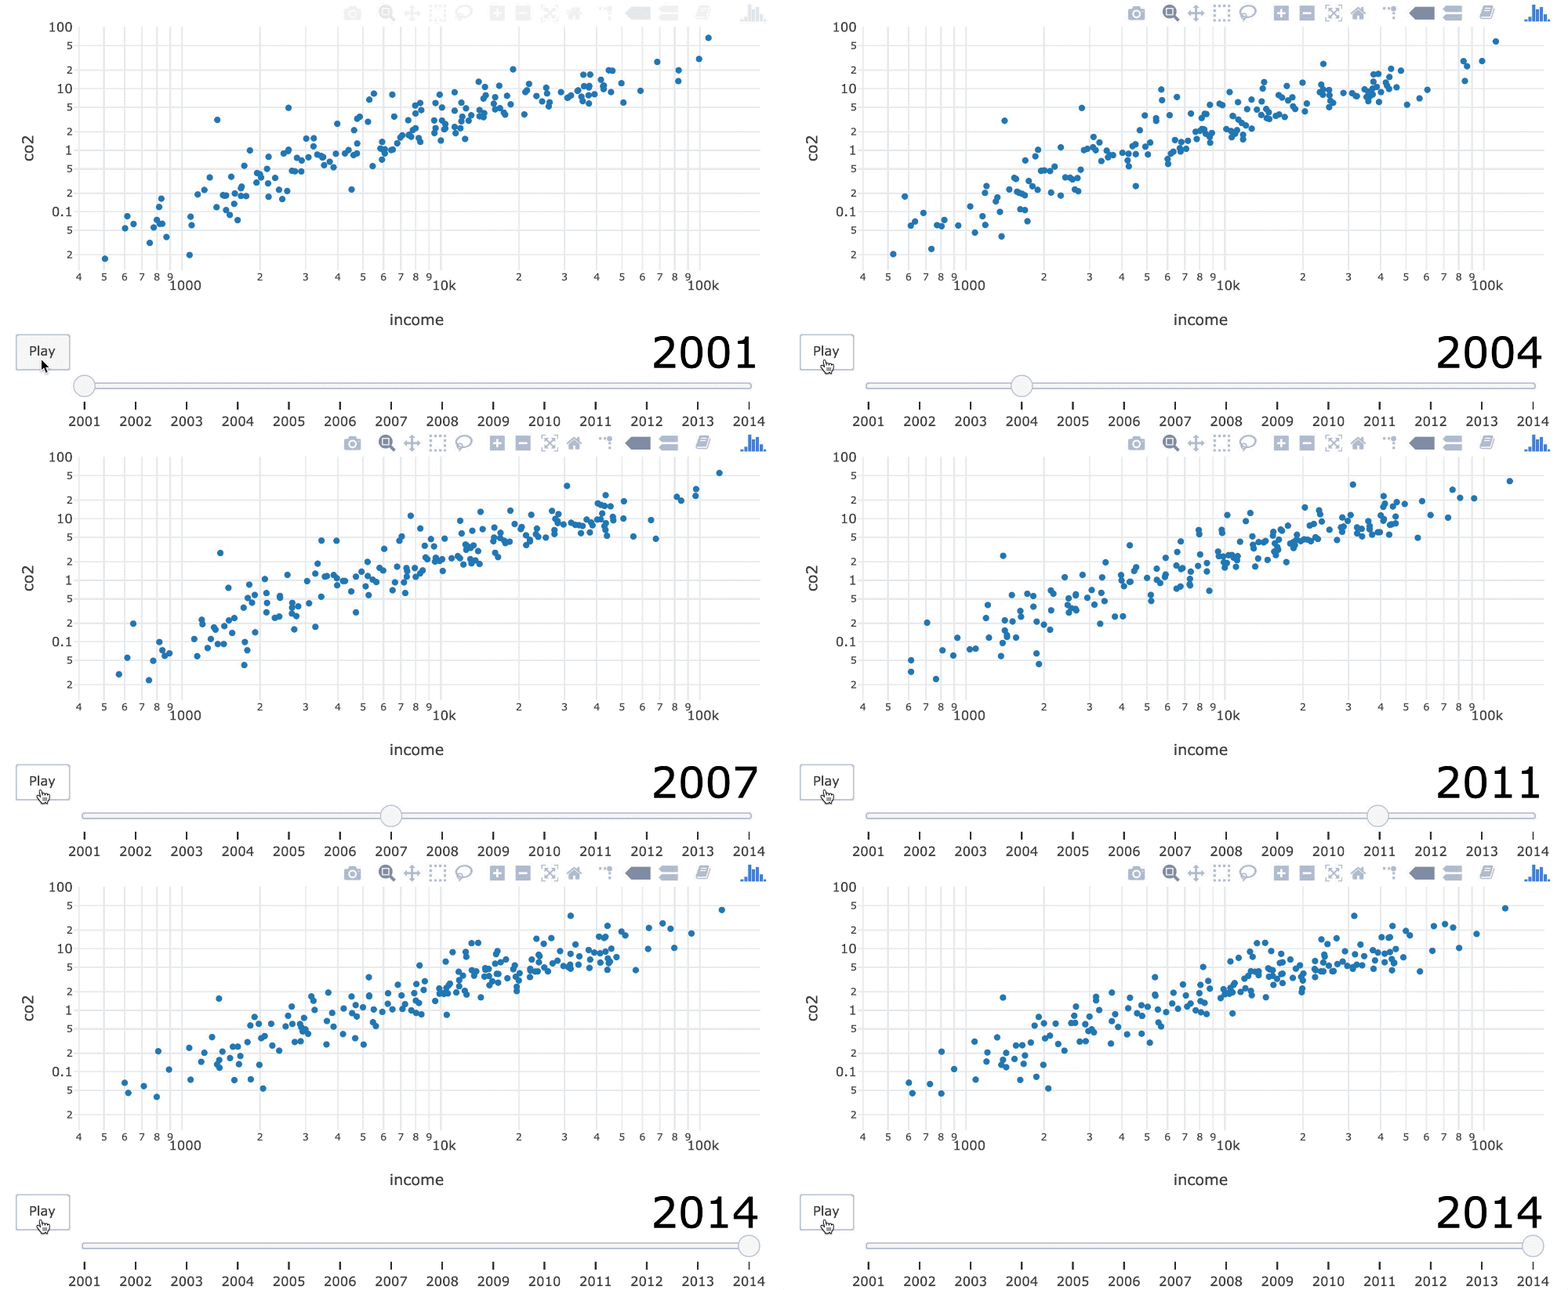
स्लाइडर टेक्स्ट 40 तक बढ़ाना और रंग काला करना.

इंटरमीडिएट इंटरएक्टिव डेटा विज़ुअलाइज़ेशन with plotly in R

टेक्स्ट लेयर

world_indicators %>%
  plot_ly(x = ~income, y = ~co2) %>%
  add_text(
    x = 6500, y = 1, text = ~year, frame = ~year,
    textfont = list(size = 150, color = toRGB("gray80"))
  )
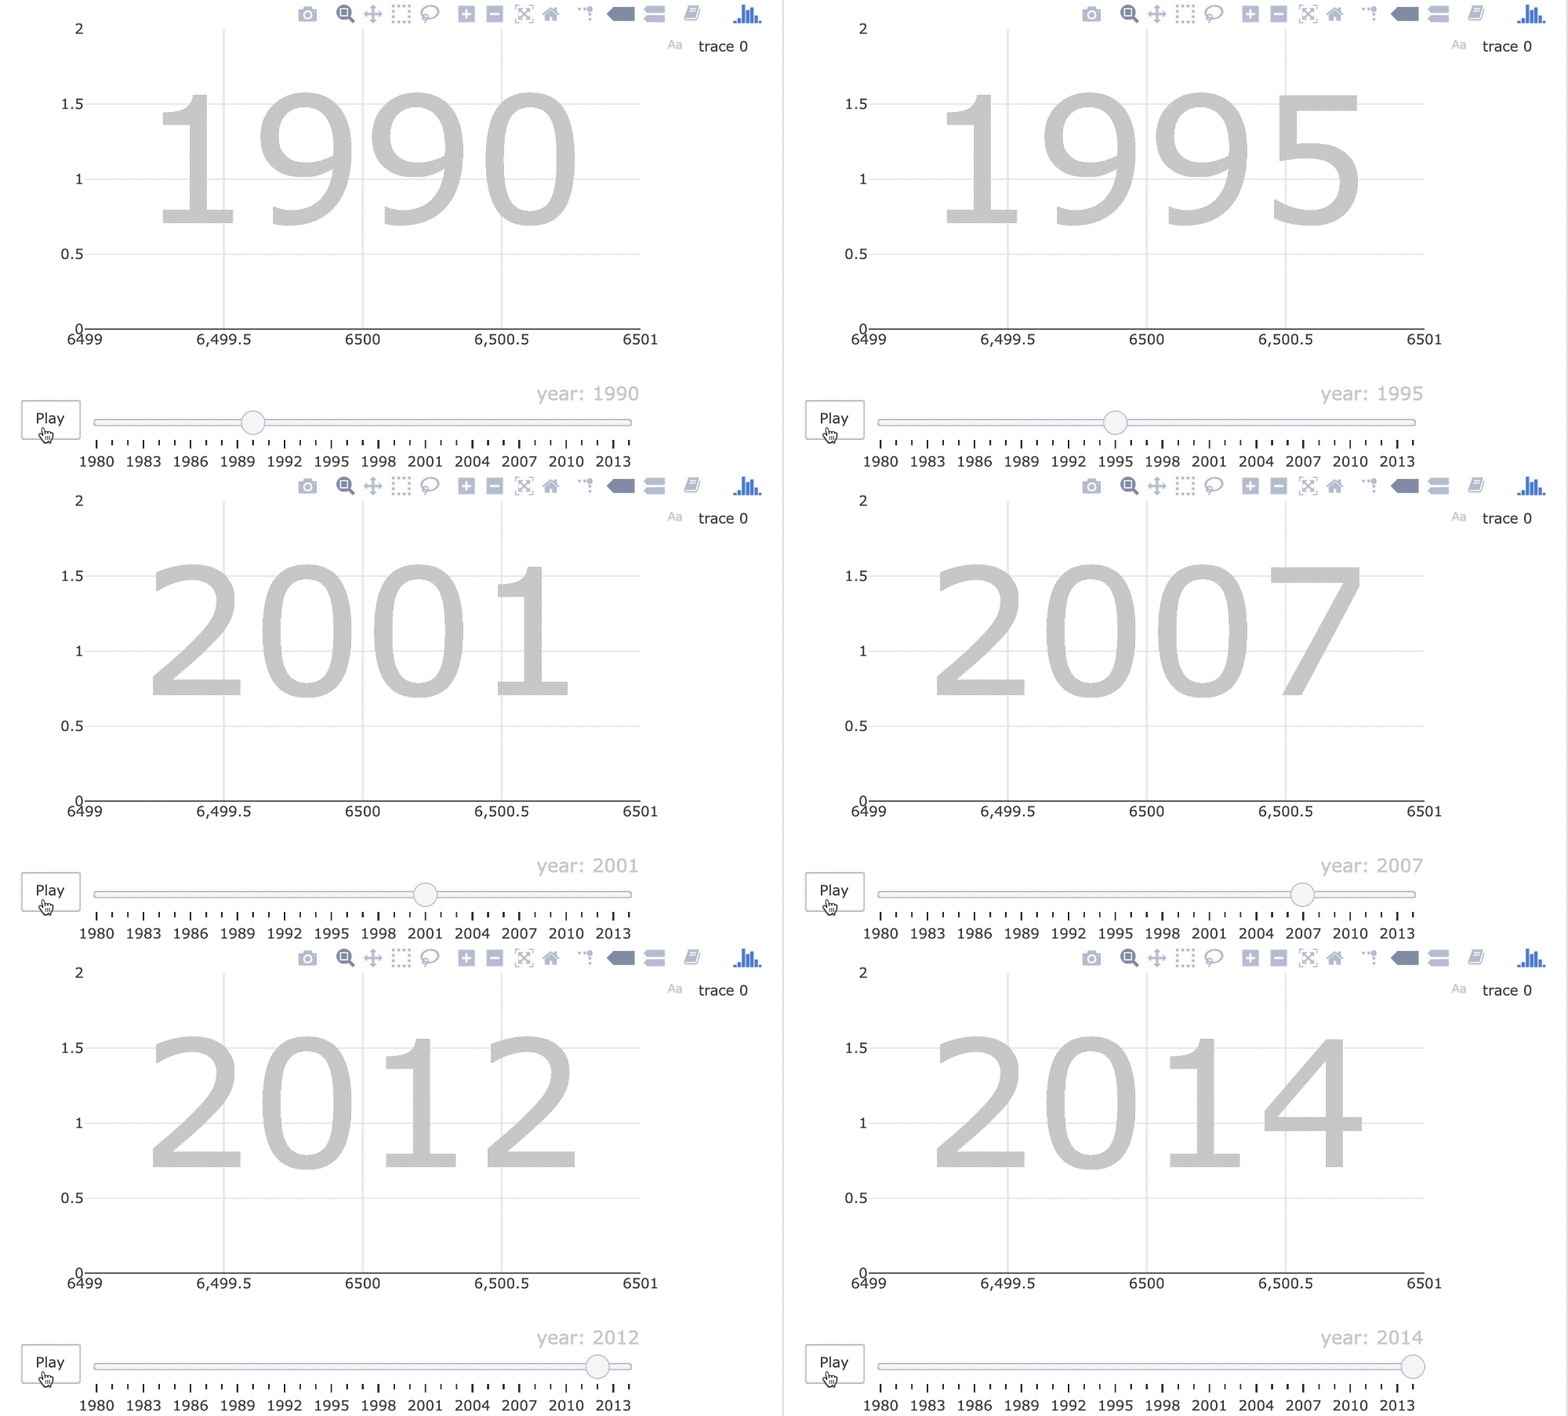
23-text-only-animation.gif

इंटरमीडिएट इंटरएक्टिव डेटा विज़ुअलाइज़ेशन with plotly in R

पॉइंट्स लेयर

world_indicators %>%
  plot_ly(x = ~income, y = ~co2) %>%
  add_text(
    x = 6500, y = 1, text = ~year, frame = ~year,
    textfont = list(size = 150, color = toRGB("gray80"))
  ) %>%
  add_markers(frame = ~year, ids = ~country) %>%
  layout(
    xaxis = list(type = "log"), yaxis = list(type = "log")
  )
इंटरमीडिएट इंटरएक्टिव डेटा विज़ुअलाइज़ेशन with plotly in R

पॉलिश करना

world_indicators %>%
  plot_ly(x = ~income, y = ~co2) %>%
  add_text(
    x = 6500, y = 1, text = ~year, frame = ~year,
    textfont = list(size = 150, color = toRGB("gray80"))
  ) %>%
  add_markers(frame = ~year, ids = ~country) %>%
  layout(
    xaxis = list(type = "log"), yaxis = list(type = "log"),
    showlegend = FALSE
  ) %>%
  animation_slider(hide = TRUE)
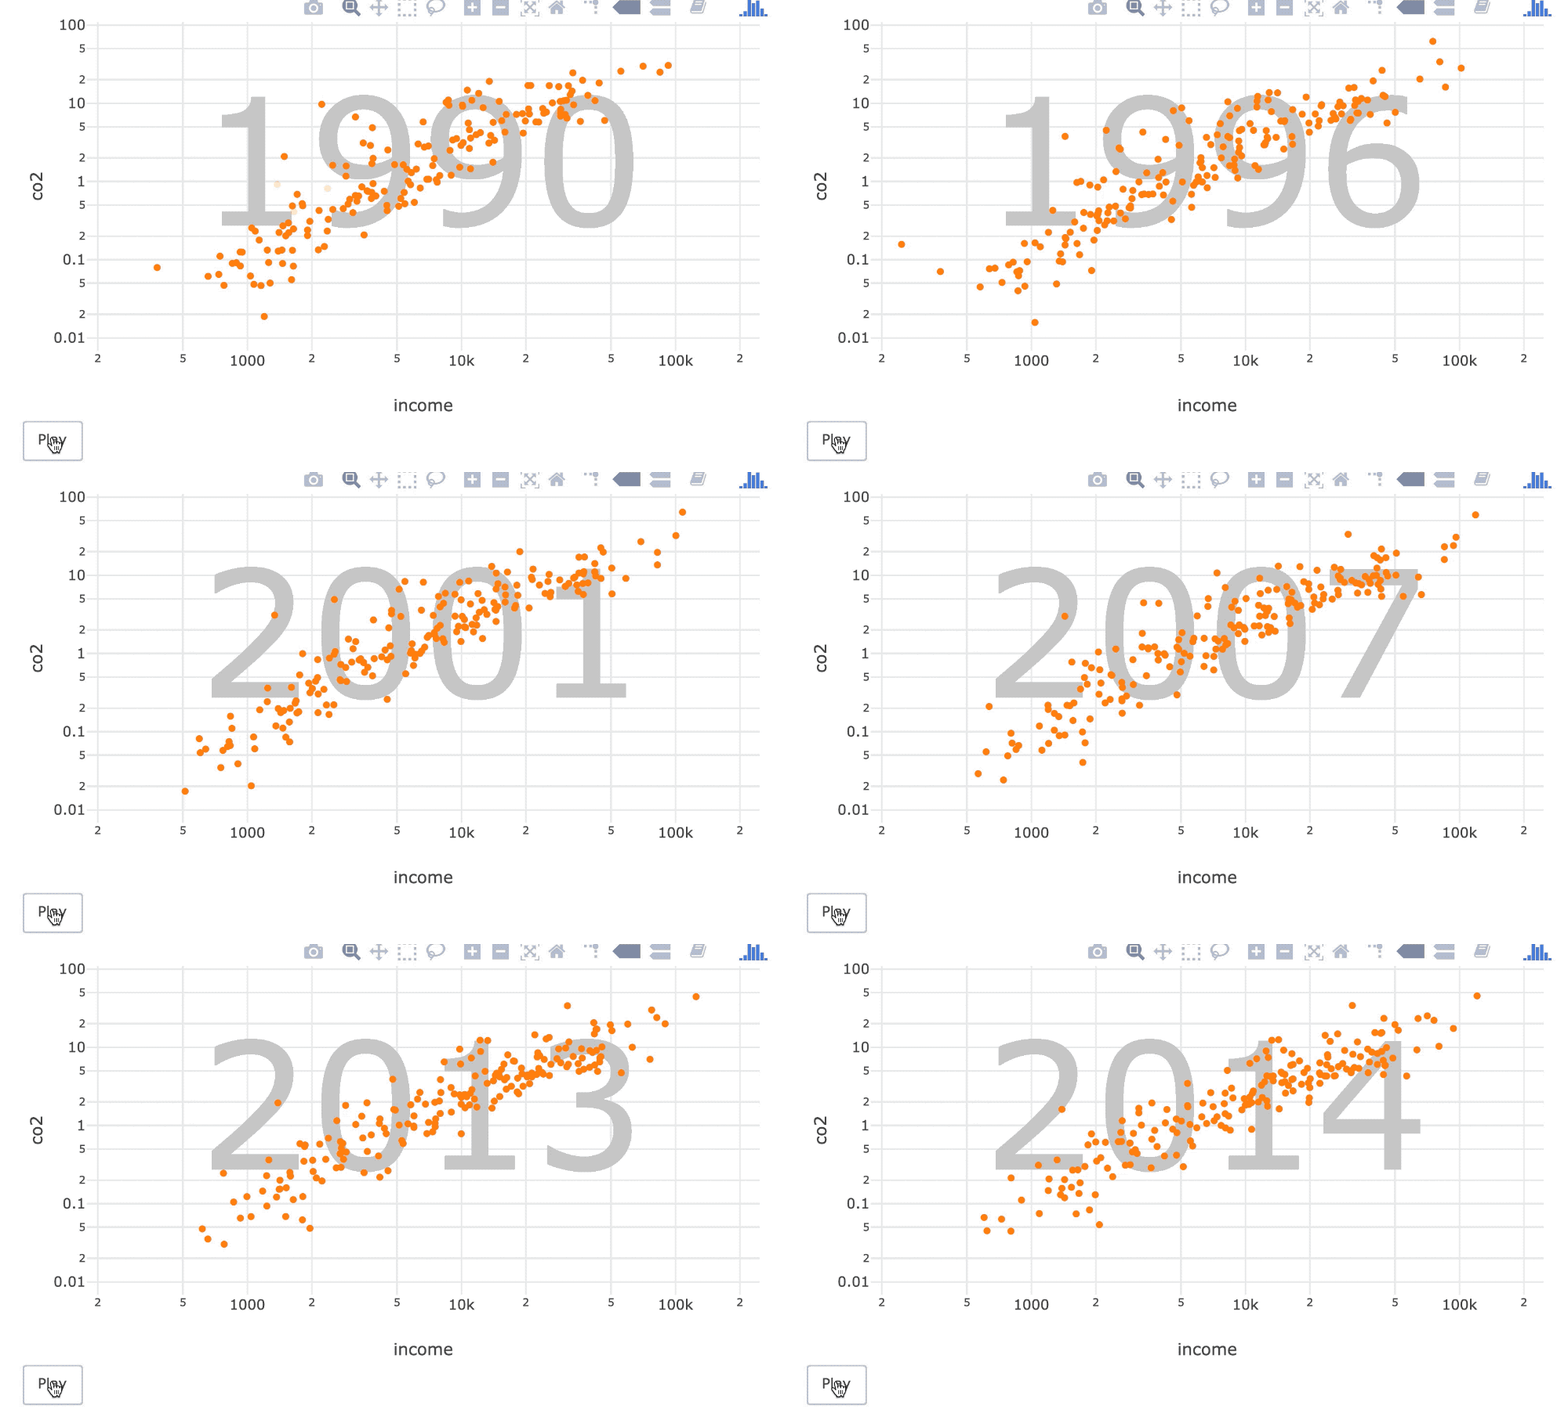
23-polished.gif

इंटरमीडिएट इंटरएक्टिव डेटा विज़ुअलाइज़ेशन with plotly in R

23-polished.gif

इंटरमीडिएट इंटरएक्टिव डेटा विज़ुअलाइज़ेशन with plotly in R

अभ्यास करते हैं!

इंटरमीडिएट इंटरएक्टिव डेटा विज़ुअलाइज़ेशन with plotly in R

Preparing Video For Download...