इंटरमीडिएट इंटरएक्टिव डेटा विज़ुअलाइज़ेशन with plotly in R
Adam Loy
Statistician, Carleton College
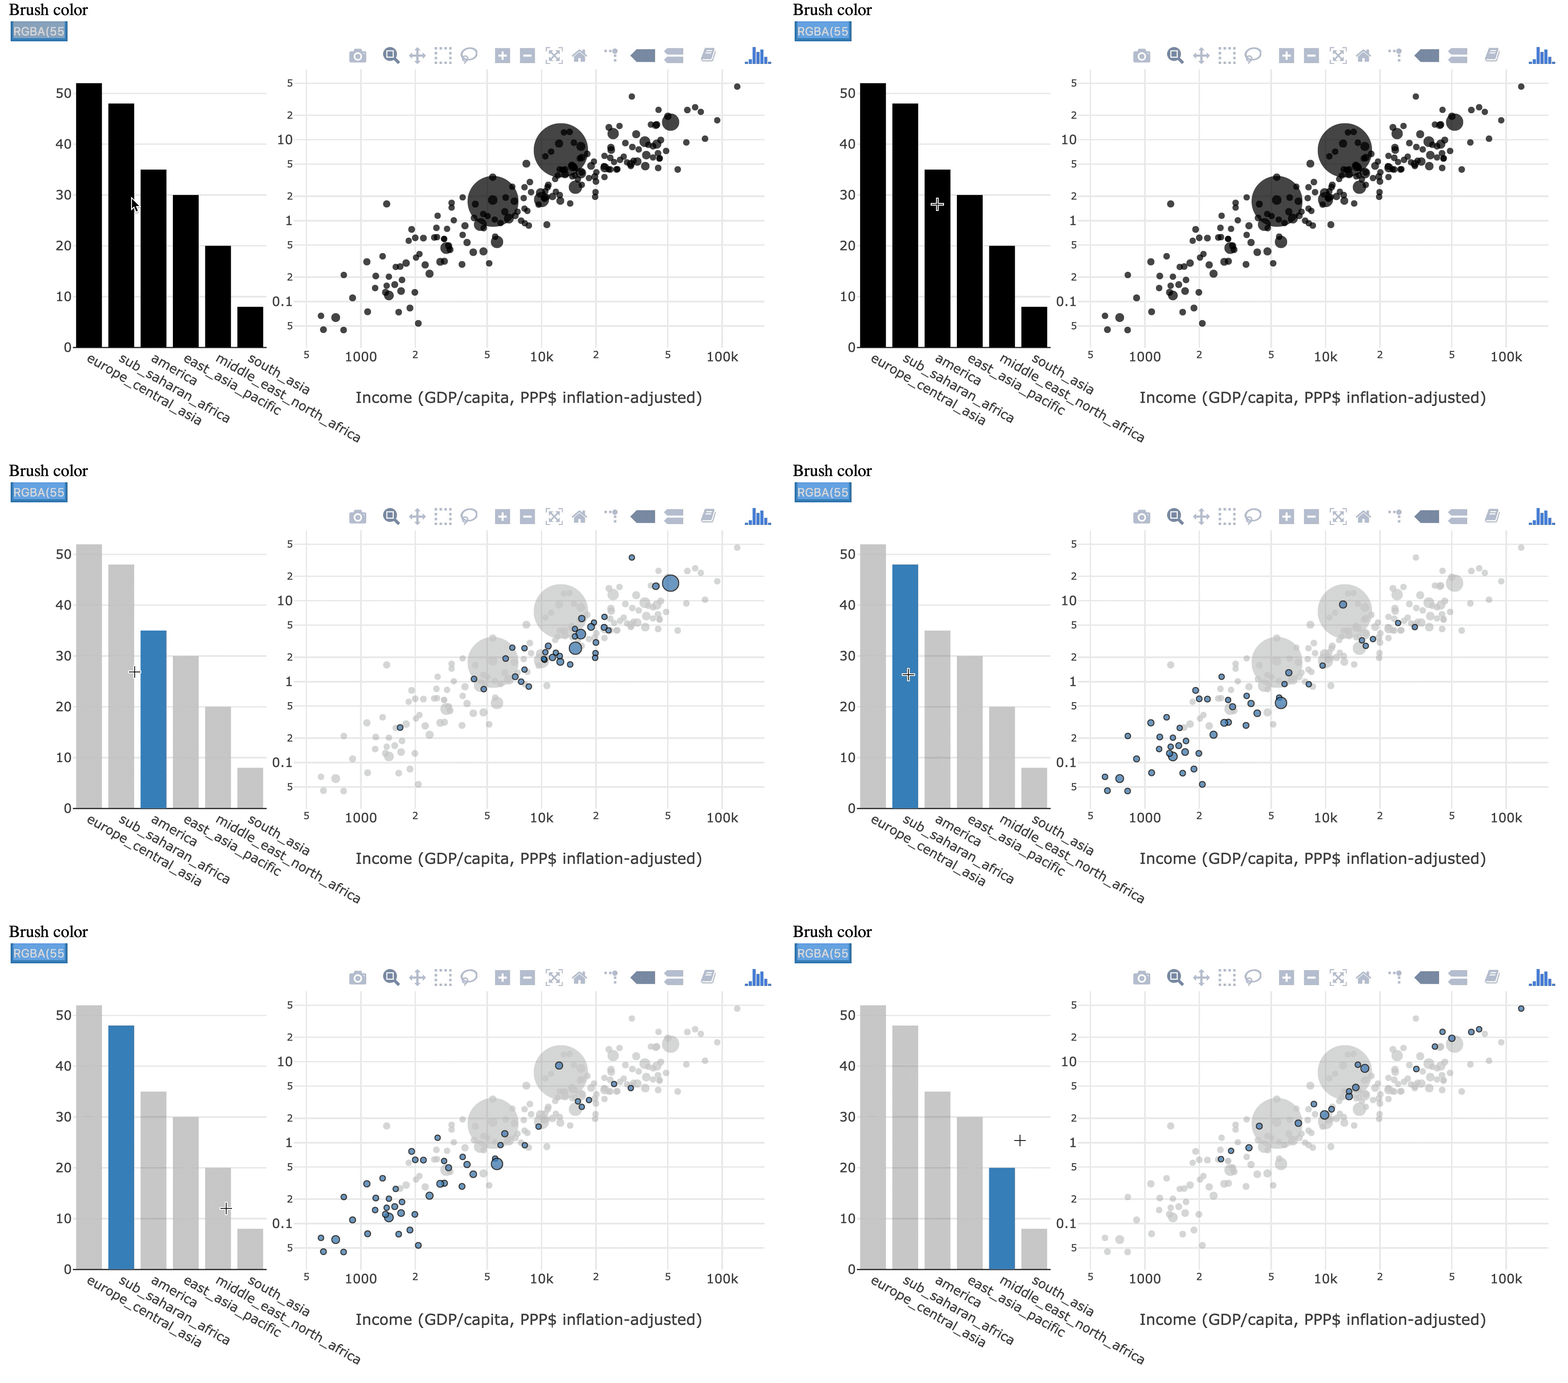
क्षणिक चयन
पहले चुने गए केस भूल जाते हैं

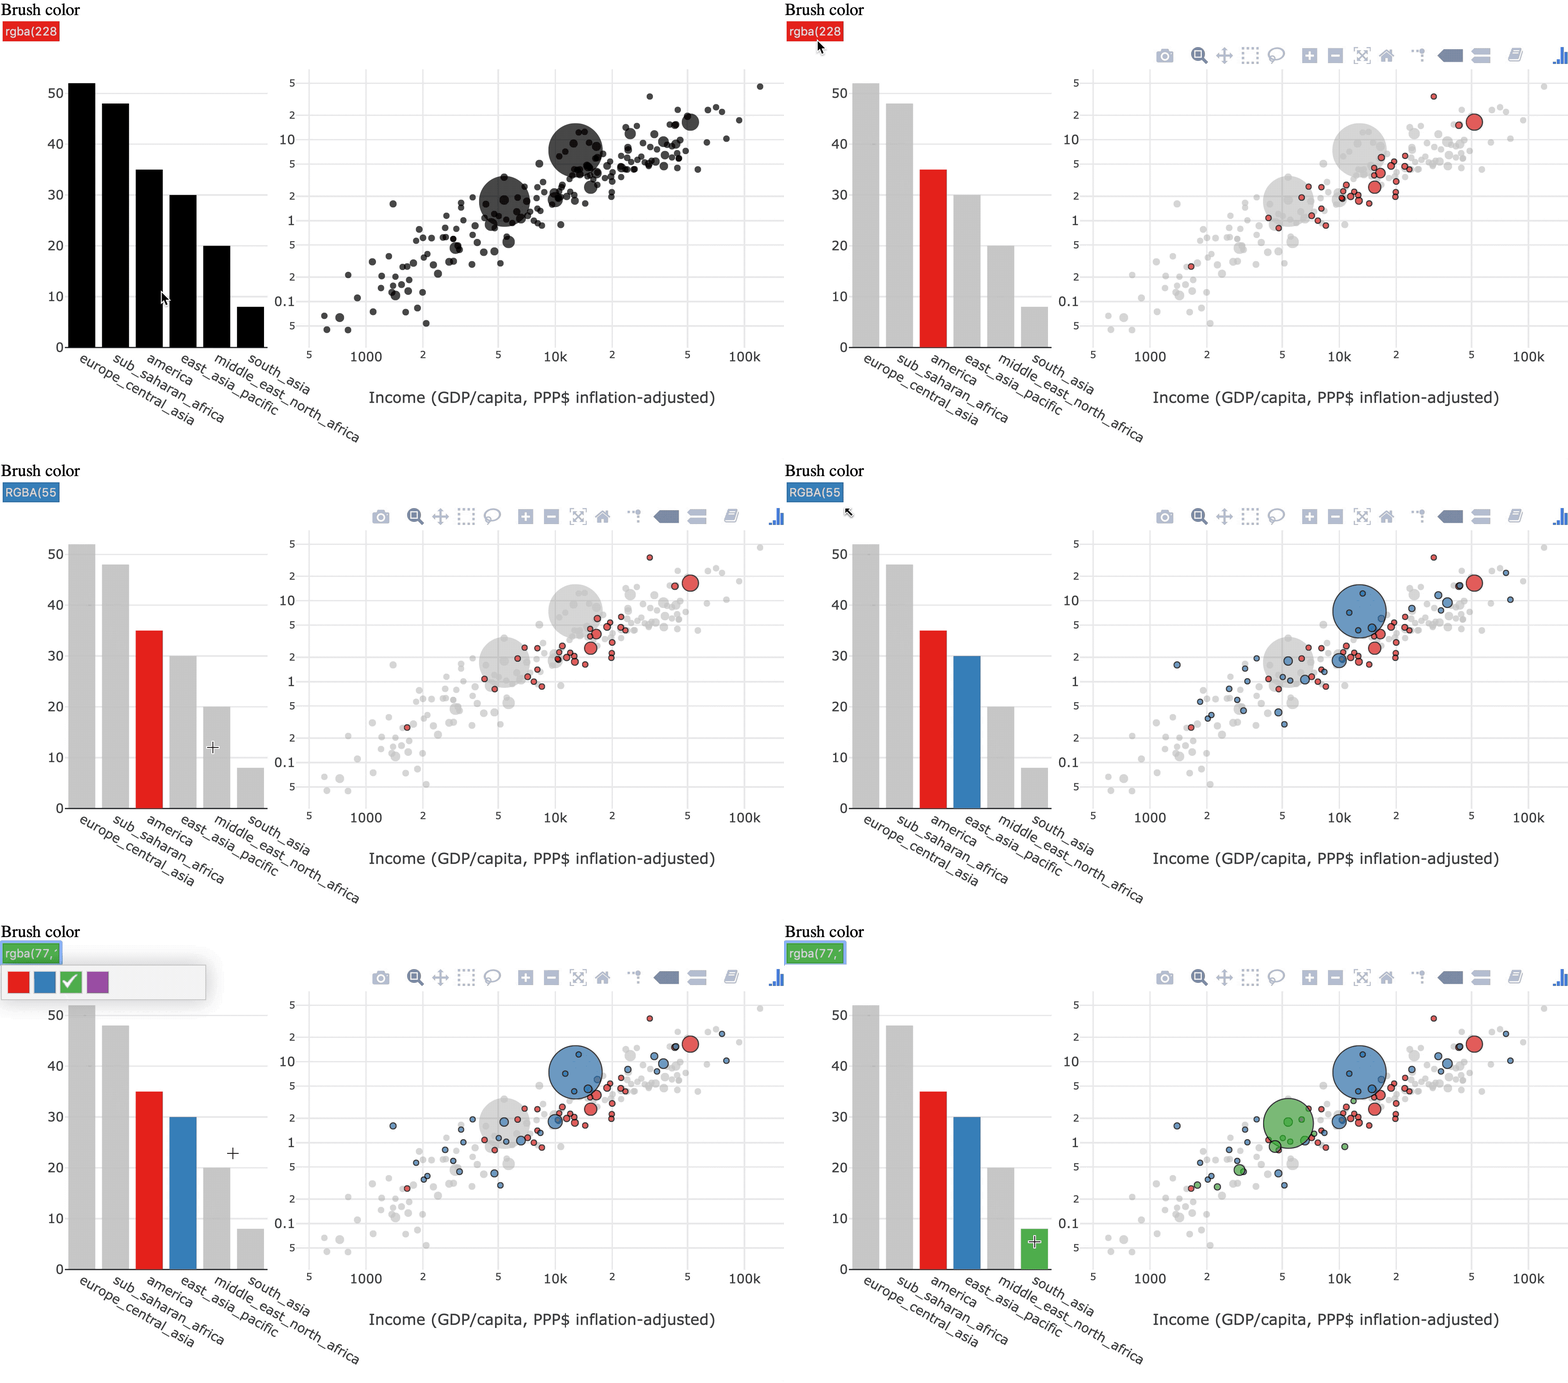
स्थायी चयन
चुने गए केस जुड़ते जाते हैं


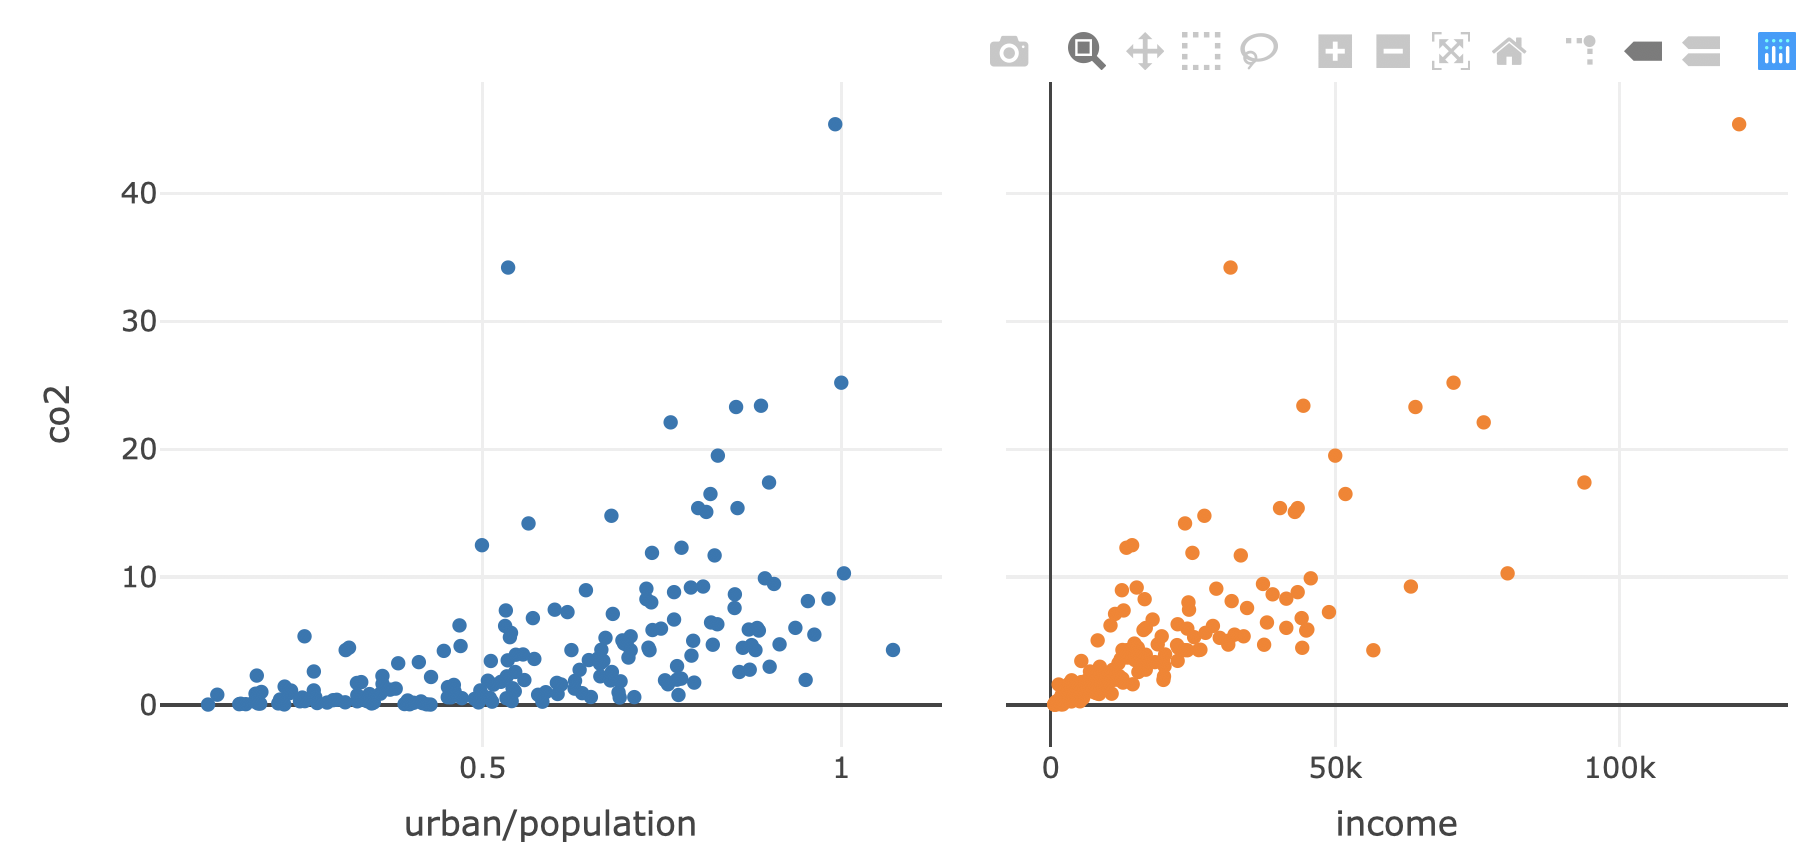
shared_data <- world2014 %>% SharedData$new()
p1 <- shared_data %>%
plot_ly(x=~urban/population, y = ~co2, text = ~country) %>%
add_markers()
p2 <- shared_data %>%
plot_ly(x=~income, y = ~co2, text = ~country) %>%
add_markers()
subplot(p1, p2, titleX = TRUE, shareY = TRUE) %>%
hide_legend()
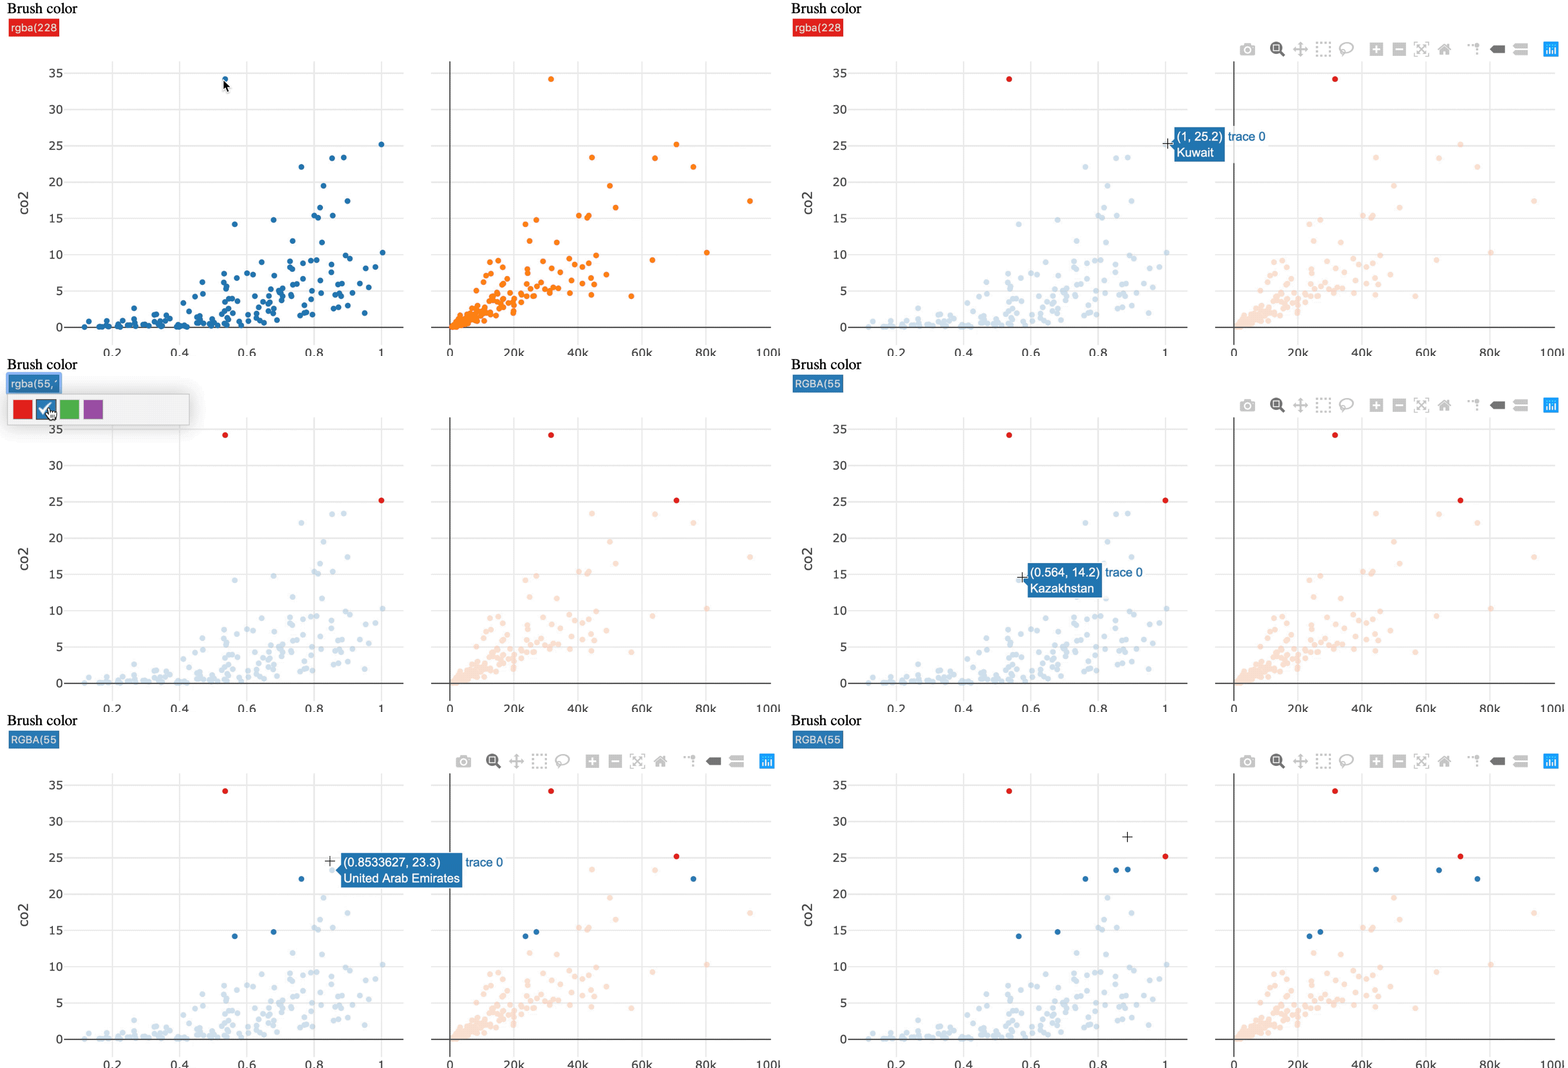
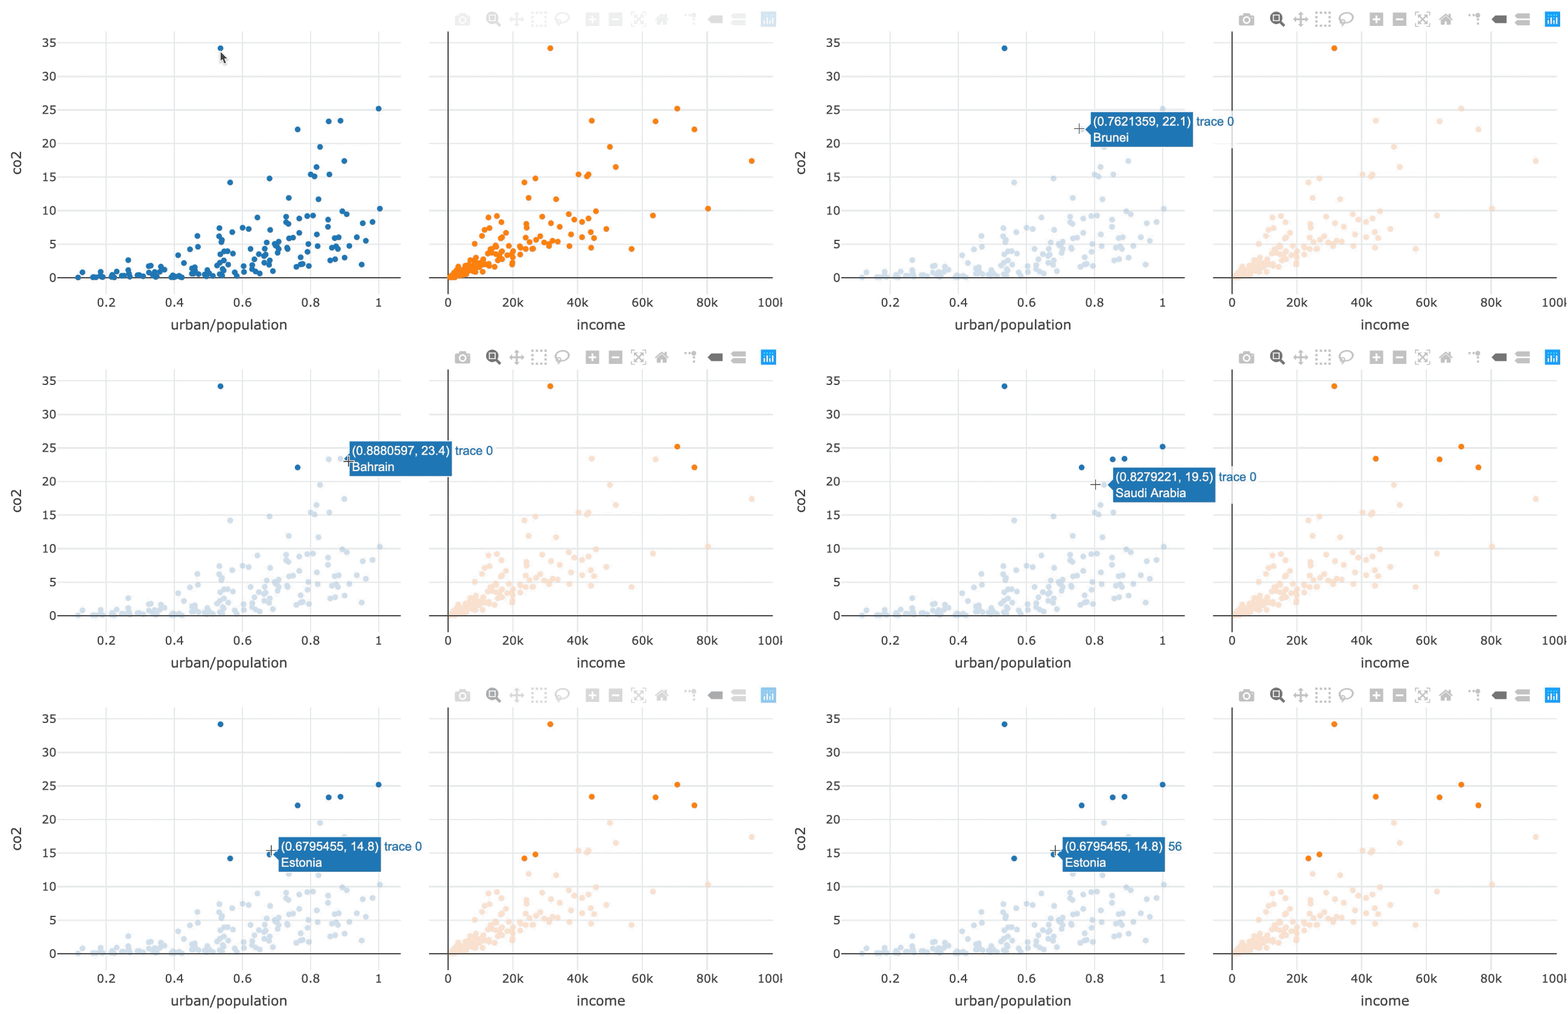
highlight() से स्थायी चयन सक्रिय करें
subplot(p1, p2, titleX = TRUE, shareY = TRUE) %>%
hide_legend() %>%
highlight(persistent = TRUE)

कलर पिकर चालू करने के लिए dynamic = TRUE जोड़ें
subplot(p1, p2, titleX = TRUE, shareY = TRUE) %>%
hide_legend() %>%
highlight(persistent = TRUE, dynamic = TRUE)
डायरेक्ट मैनिपुलेशन
चयन ग्राफिकल एलिमेंट्स से इंटरैक्ट करके होता है

इनडायरेक्ट मैनिपुलेशन
चयन चार्ट के बाहर क्वेरी से होता है


world_indicators %>%
SharedData$new(key = ~country) %>%
plot_ly(x = ~year, y = ~income, alpha = 0.5) %>%
group_by(country) %>%
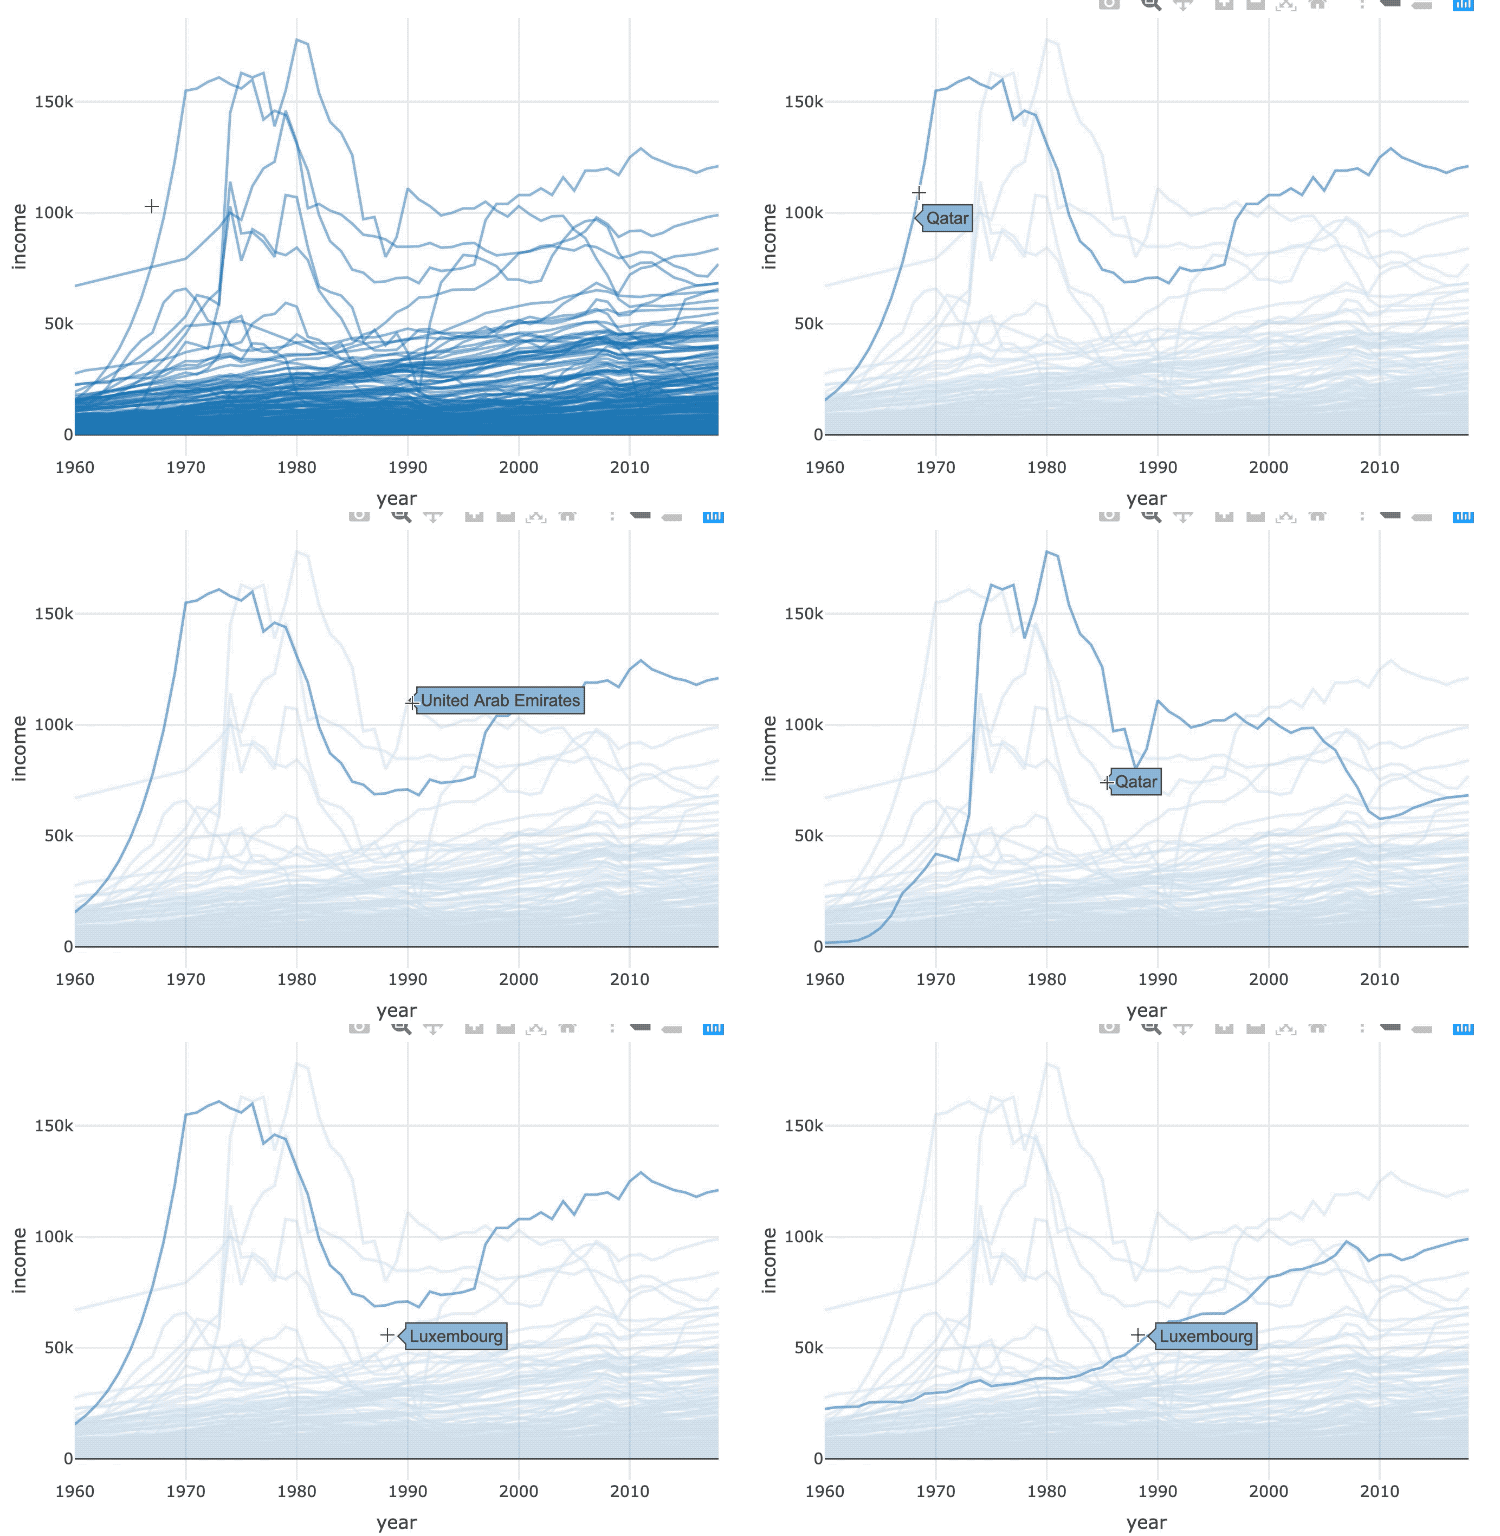
add_lines()
world_indicators %>%
SharedData$new(key = ~country, group = "Select a country") %>%
plot_ly(x = ~year, y = ~income, alpha = 0.5) %>%
group_by(country) %>%
add_lines() %>%
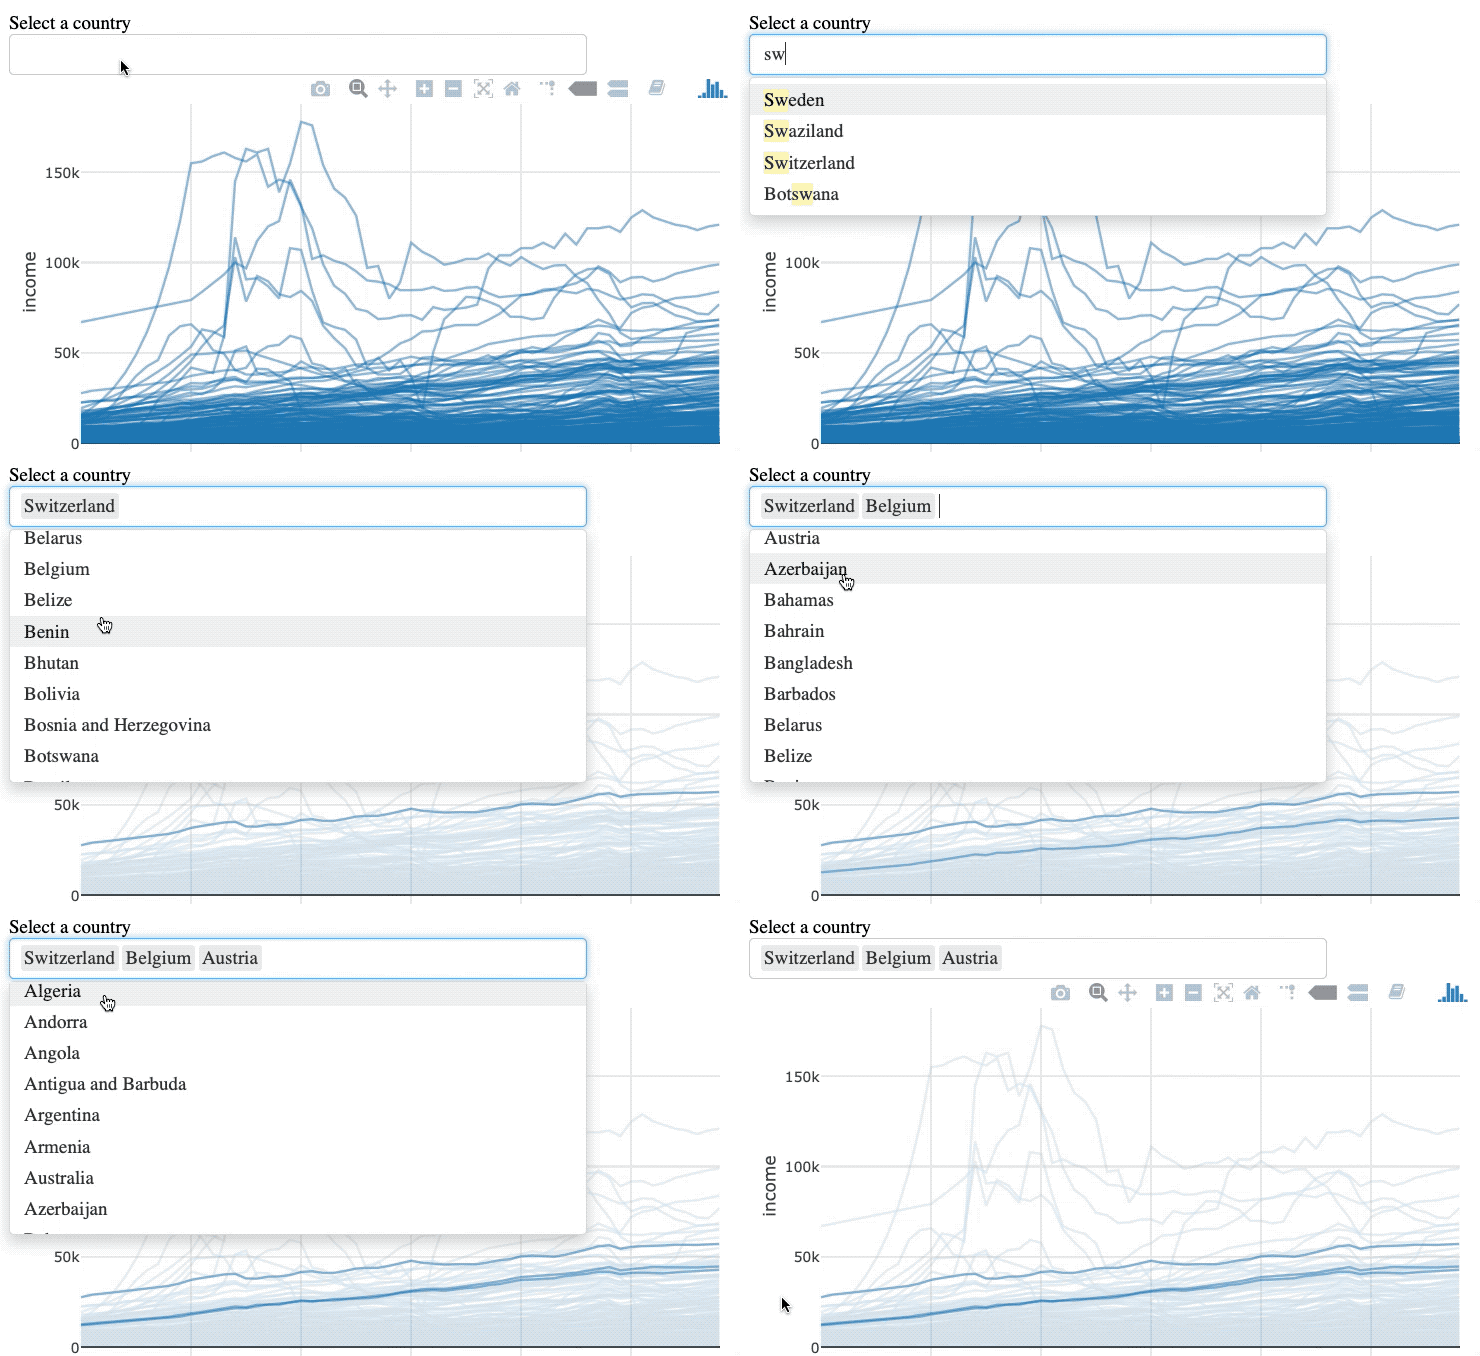
highlight(selectize = TRUE)

इंटरमीडिएट इंटरएक्टिव डेटा विज़ुअलाइज़ेशन with plotly in R