एनिमेशन को पॉलिश करना

इंटरमीडिएट इंटरएक्टिव डेटा विज़ुअलाइज़ेशन with plotly in R

Adam Loy

Statistician, Carleton College

कस्टमाइज़ेशन

एनिमेशन विकल्प

  • फ्रेम के बीच समय
  • फ्रेम ट्रांज़िशन
  • स्लाइडर का रूप

प्लॉटिंग विकल्प

  • ग्लिफ़ का रंग, आकार, साइज
  • अक्ष लेबल, ट्रांसफ़ॉर्मेशन
  • टूल टिप्स (जैसे hover टेक्स्ट)
इंटरमीडिएट इंटरएक्टिव डेटा विज़ुअलाइज़ेशन with plotly in R

एनिमेशन विकल्प

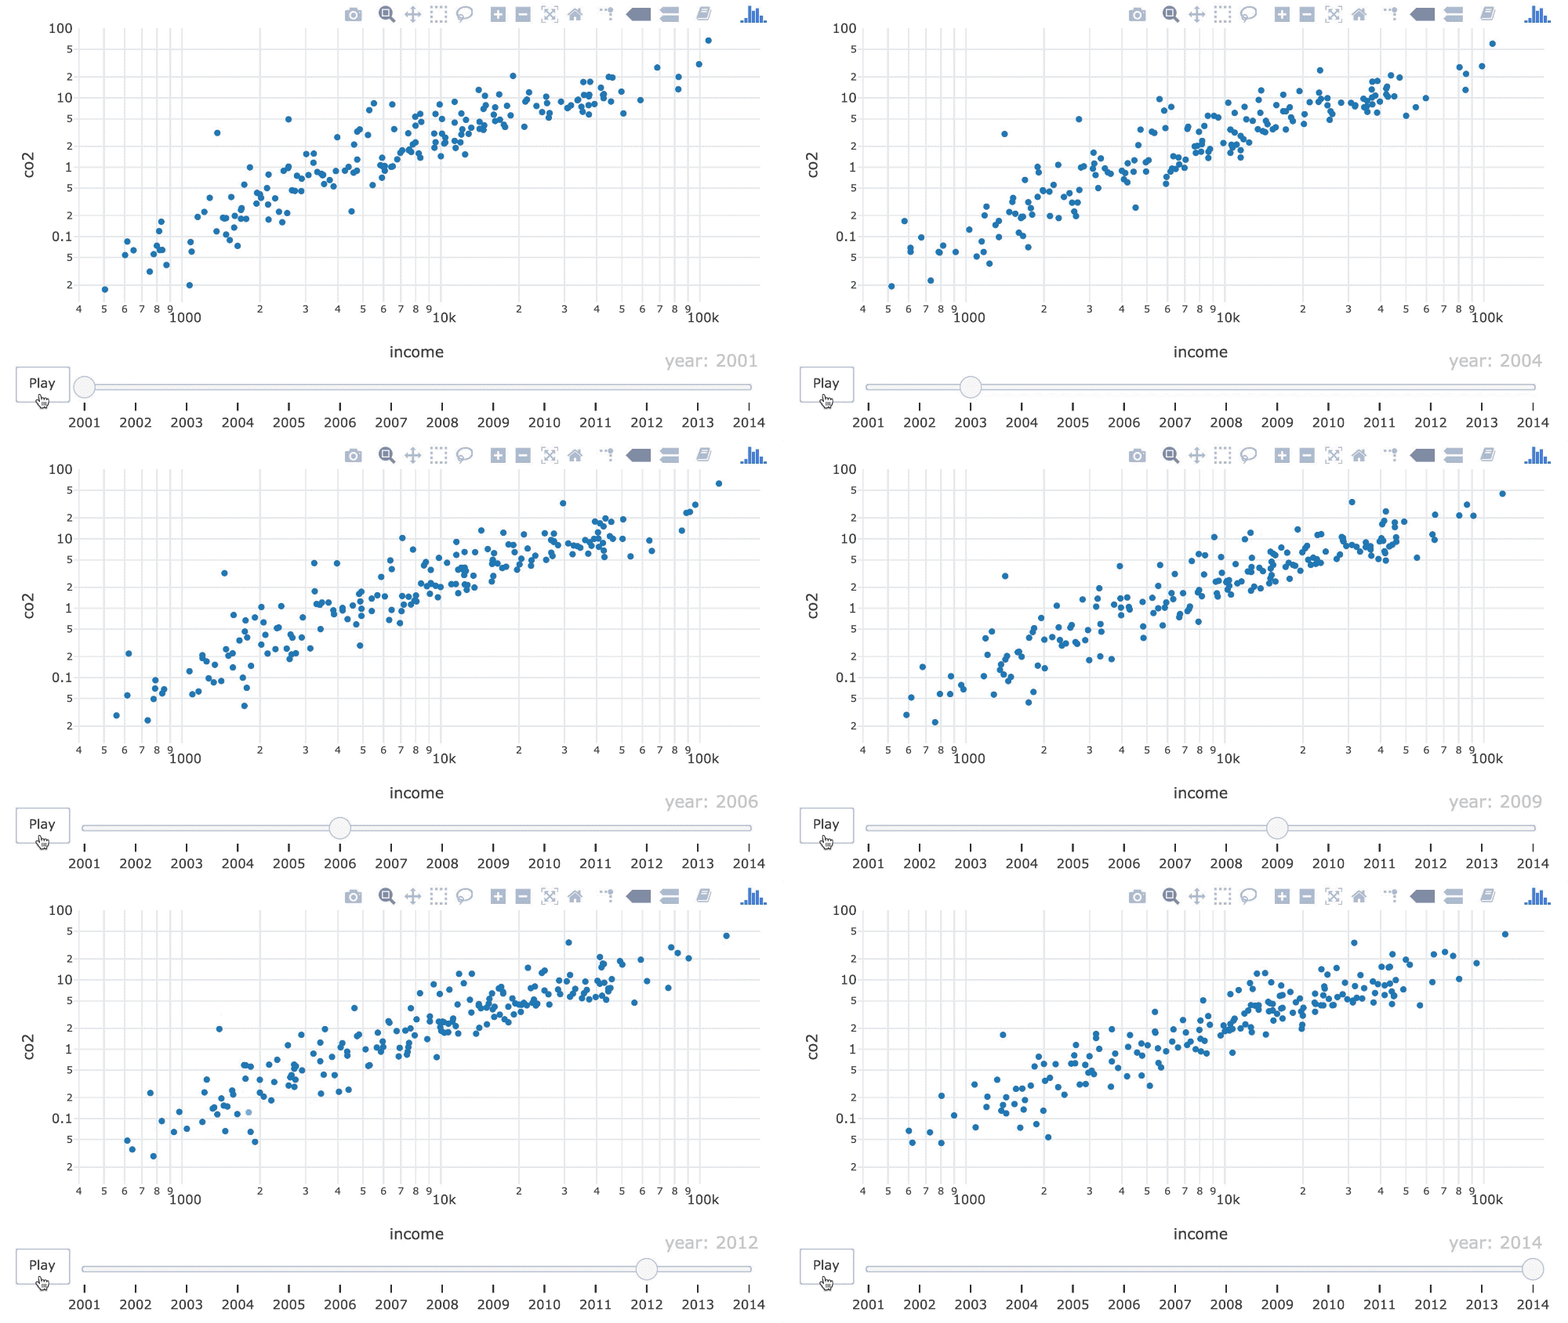
डिफ़ॉल्ट सेटिंग्स के साथ बेसिक एनिमेशन.

ani <- world_indicators %>%
  plot_ly(x = ~income, y = ~co2) %>%
  add_markers(frame = ~year, 
              ids = ~country, 
              showlegend = FALSE) %>%
  layout(xaxis = list(type = "log"),
         yaxis = list(type = "log"))
इंटरमीडिएट इंटरएक्टिव डेटा विज़ुअलाइज़ेशन with plotly in R

एनिमेशन विकल्प

डिफ़ॉल्ट सेटिंग्स के साथ बेसिक एनिमेशन.

ani %>%
  animation_opts(
      frame = 500, 
      transition = frame,
      easing = "linear",
      redraw = TRUE
   )
इंटरमीडिएट इंटरएक्टिव डेटा विज़ुअलाइज़ेशन with plotly in R

गति बढ़ाना

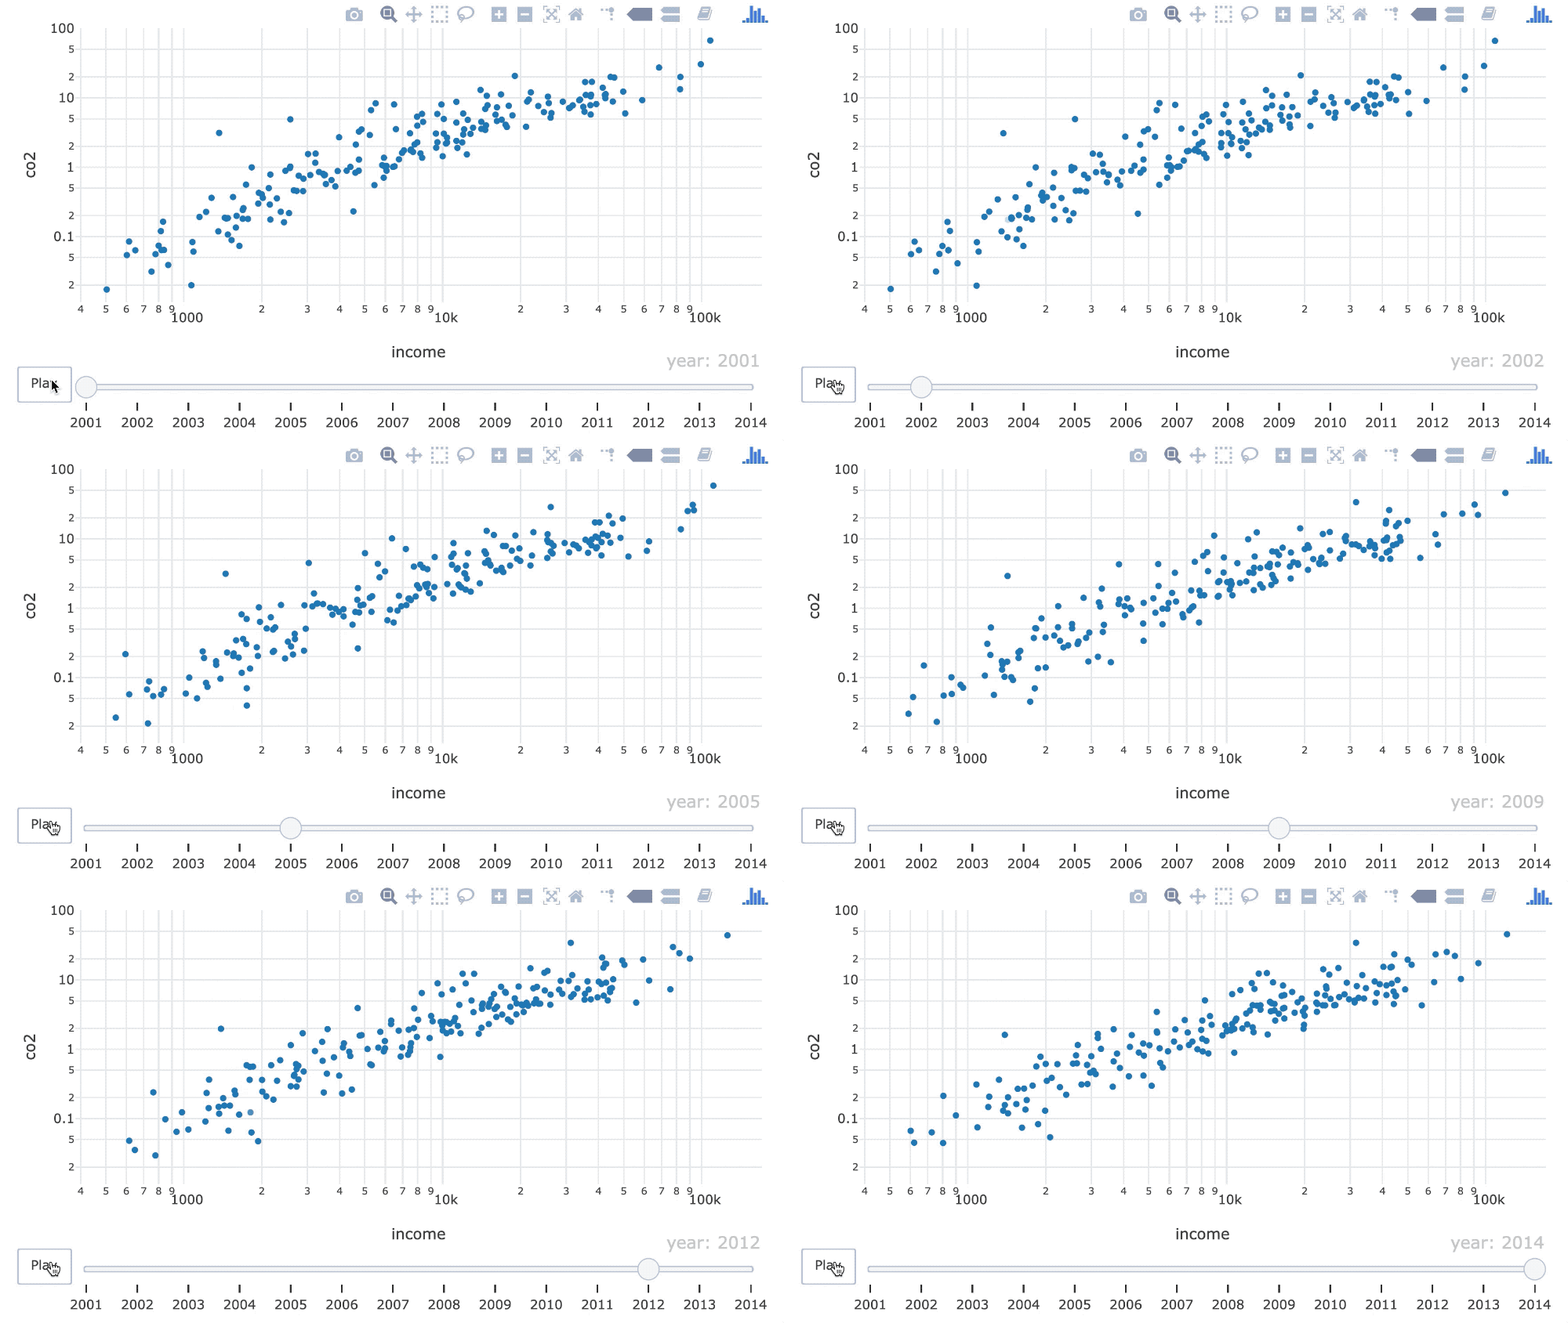
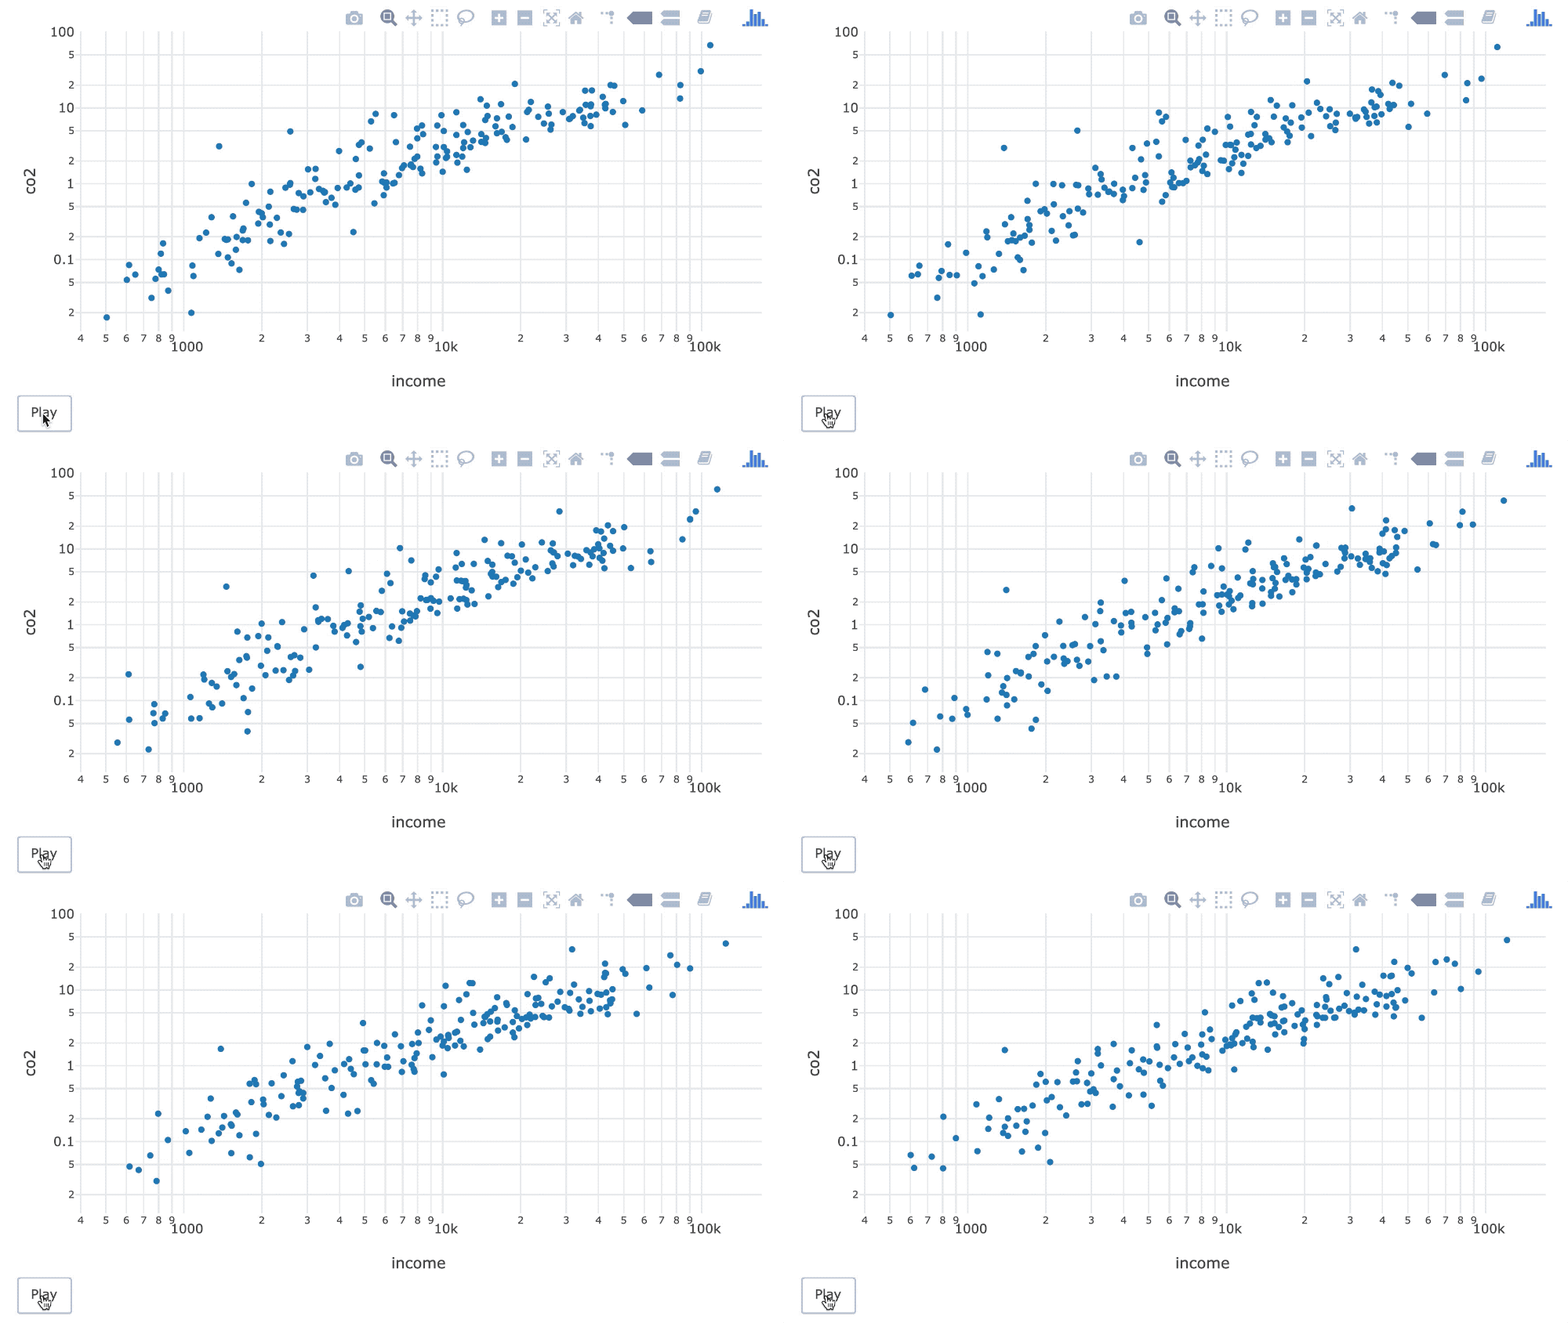
frame = 300 से तेज़ किया गया स्कैटरप्लॉट एनिमेशन.

ani %>%
  animation_opts(frame = 300)
इंटरमीडिएट इंटरएक्टिव डेटा विज़ुअलाइज़ेशन with plotly in R

फ्रेमों के बीच विराम

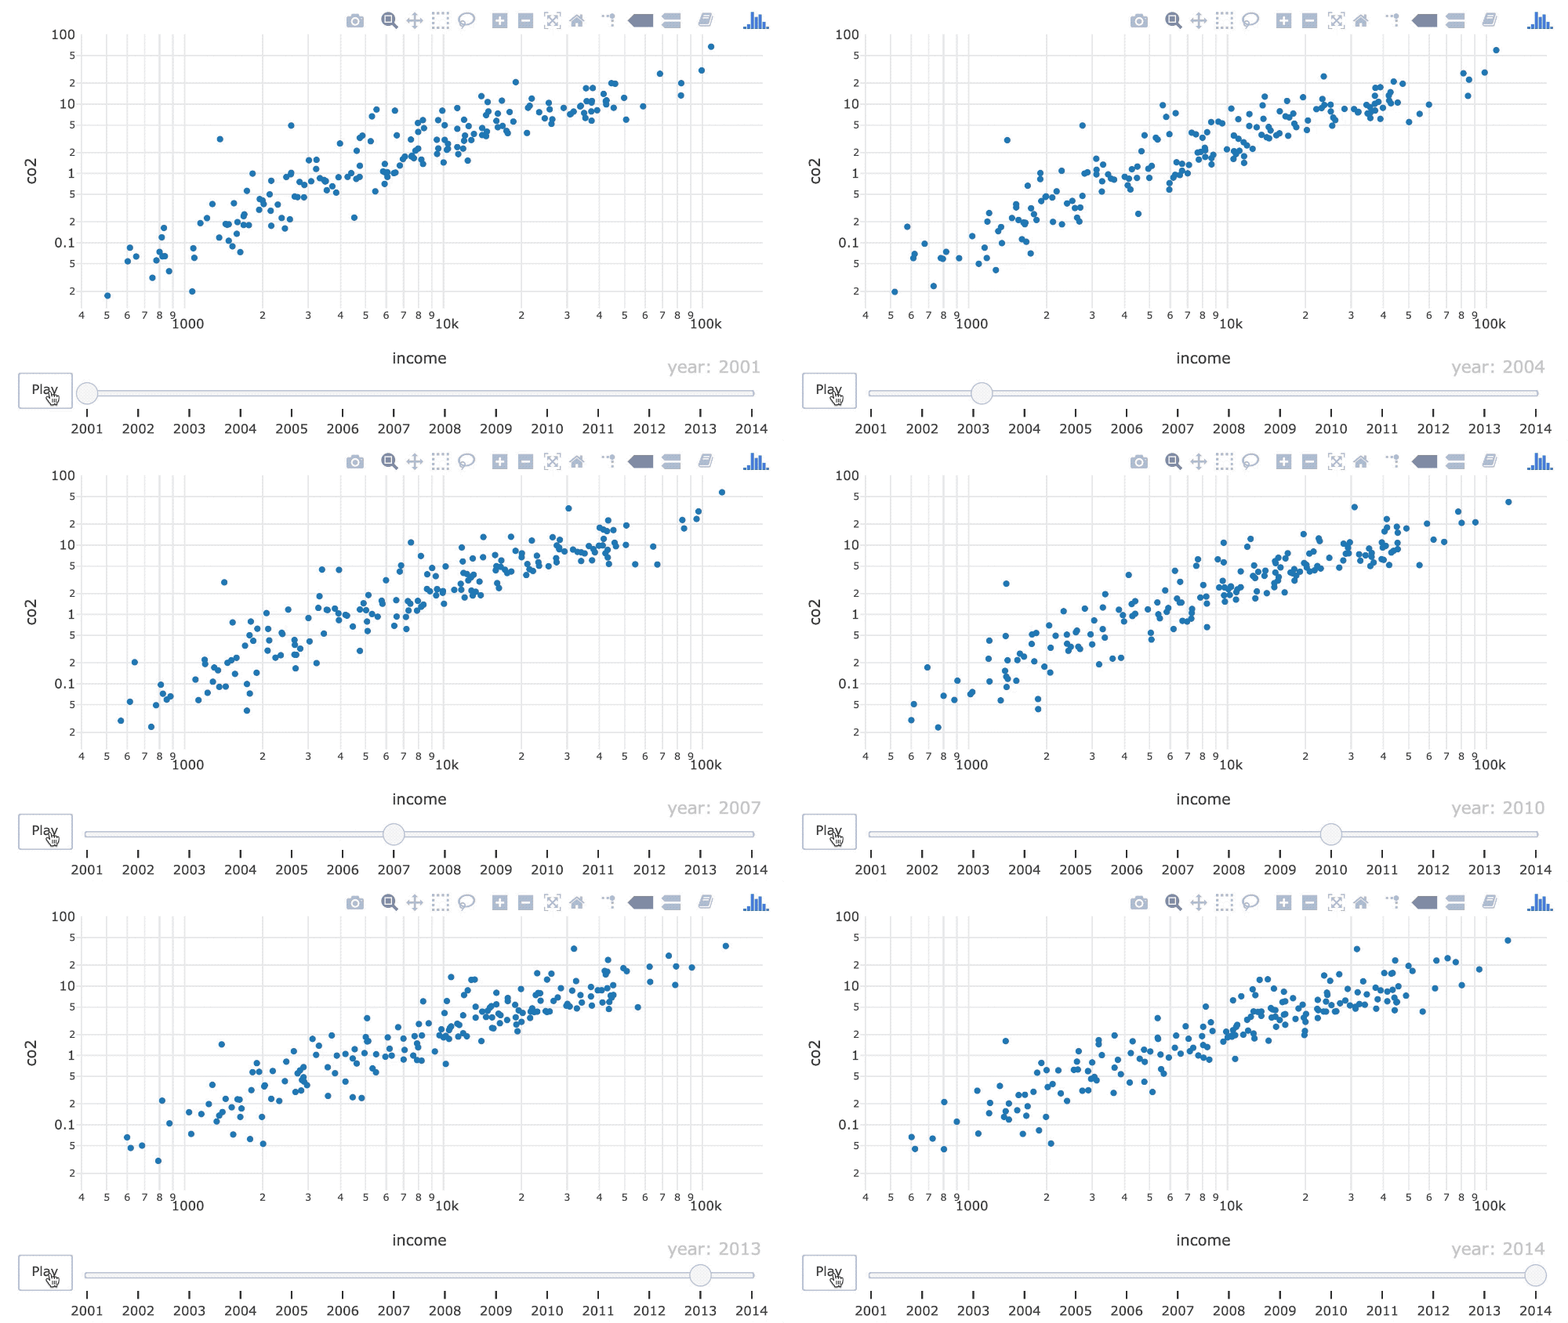
हर फ्रेम पर 350 मिलीसेकंड रुकाव वाला एनिमेशन.

ani %>%
  animation_opts(
     frame = 700, 
     transition = 350
  )
इंटरमीडिएट इंटरएक्टिव डेटा विज़ुअलाइज़ेशन with plotly in R

बाउंस करते पॉइंट्स

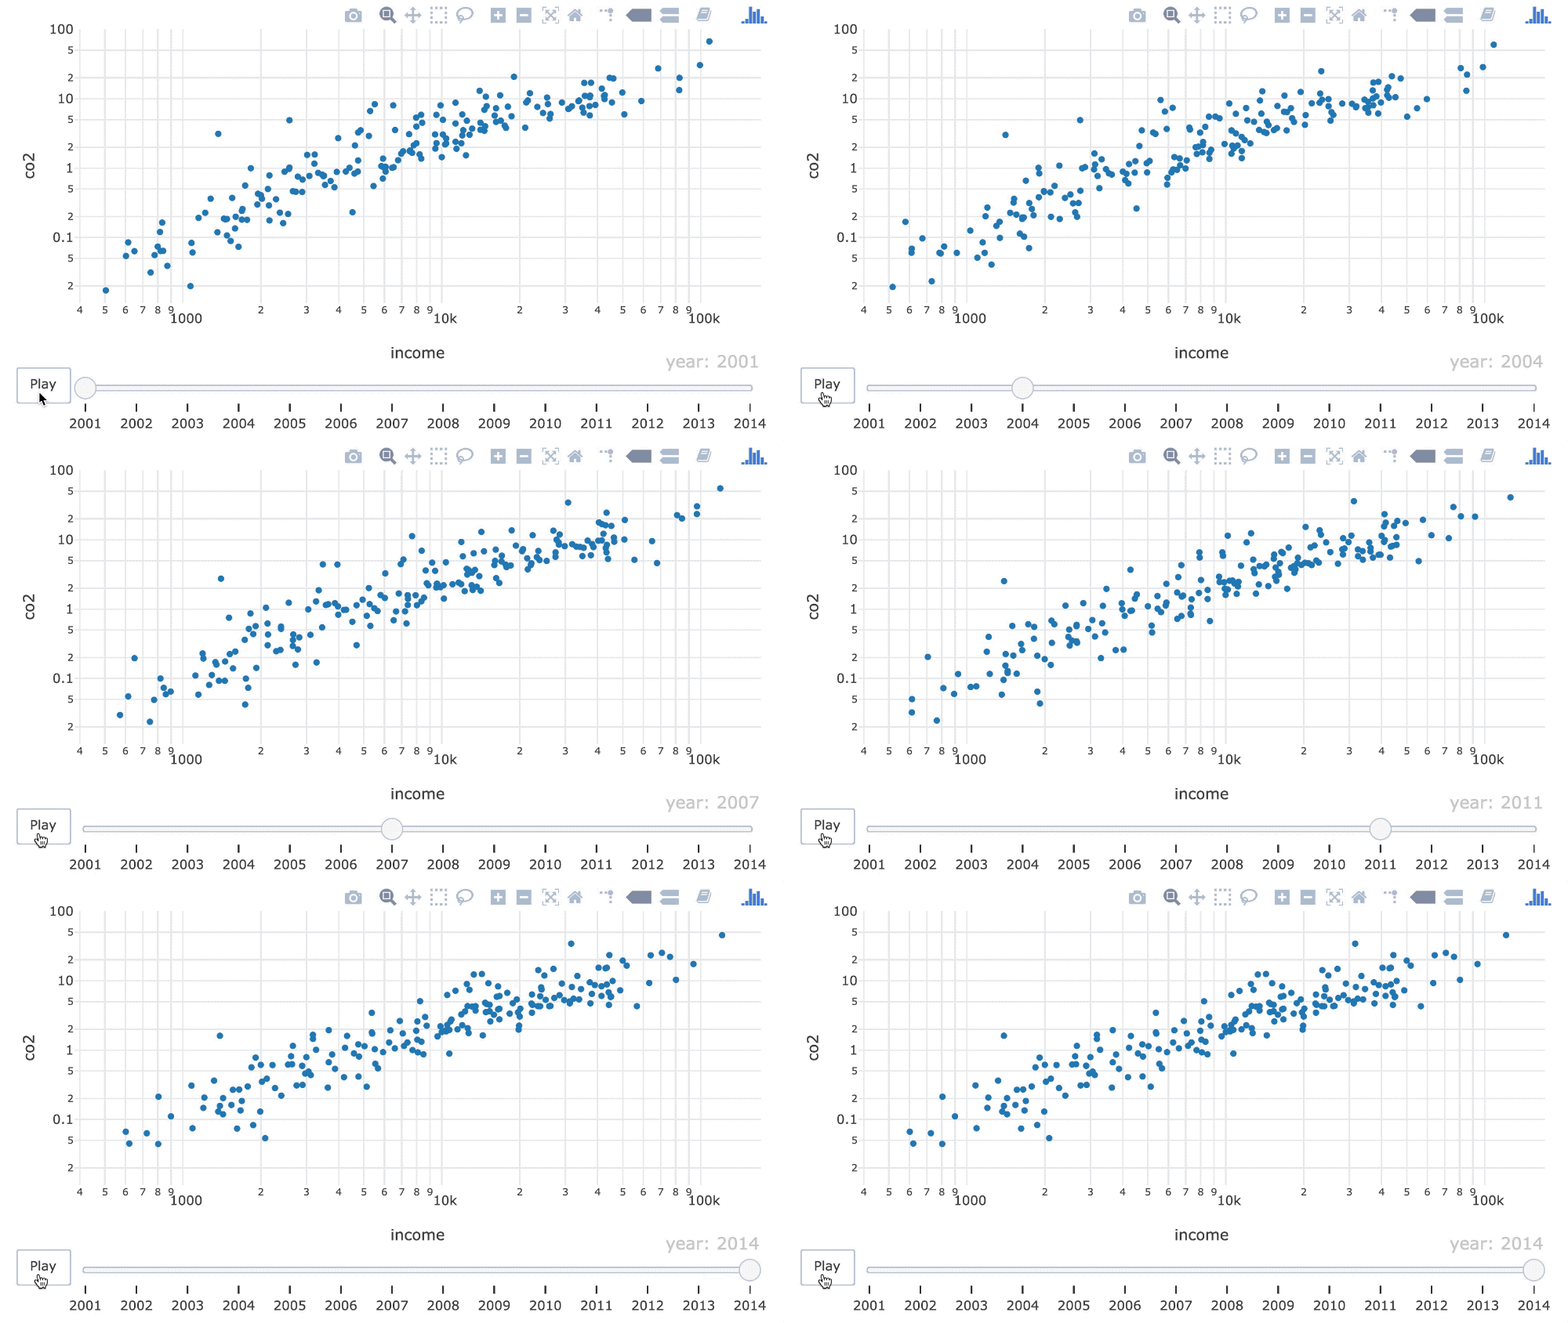
easing = "bounce" वाला एनिमेशन.

ani %>%
  animation_opts(easing = "bounce")

बेसिक easing विकल्प:

"linear", "quad", "cubic", "sin", "exp", "circle", "elastic", "back", "bounce"

इंटरमीडिएट इंटरएक्टिव डेटा विज़ुअलाइज़ेशन with plotly in R

स्लाइडर विकल्प

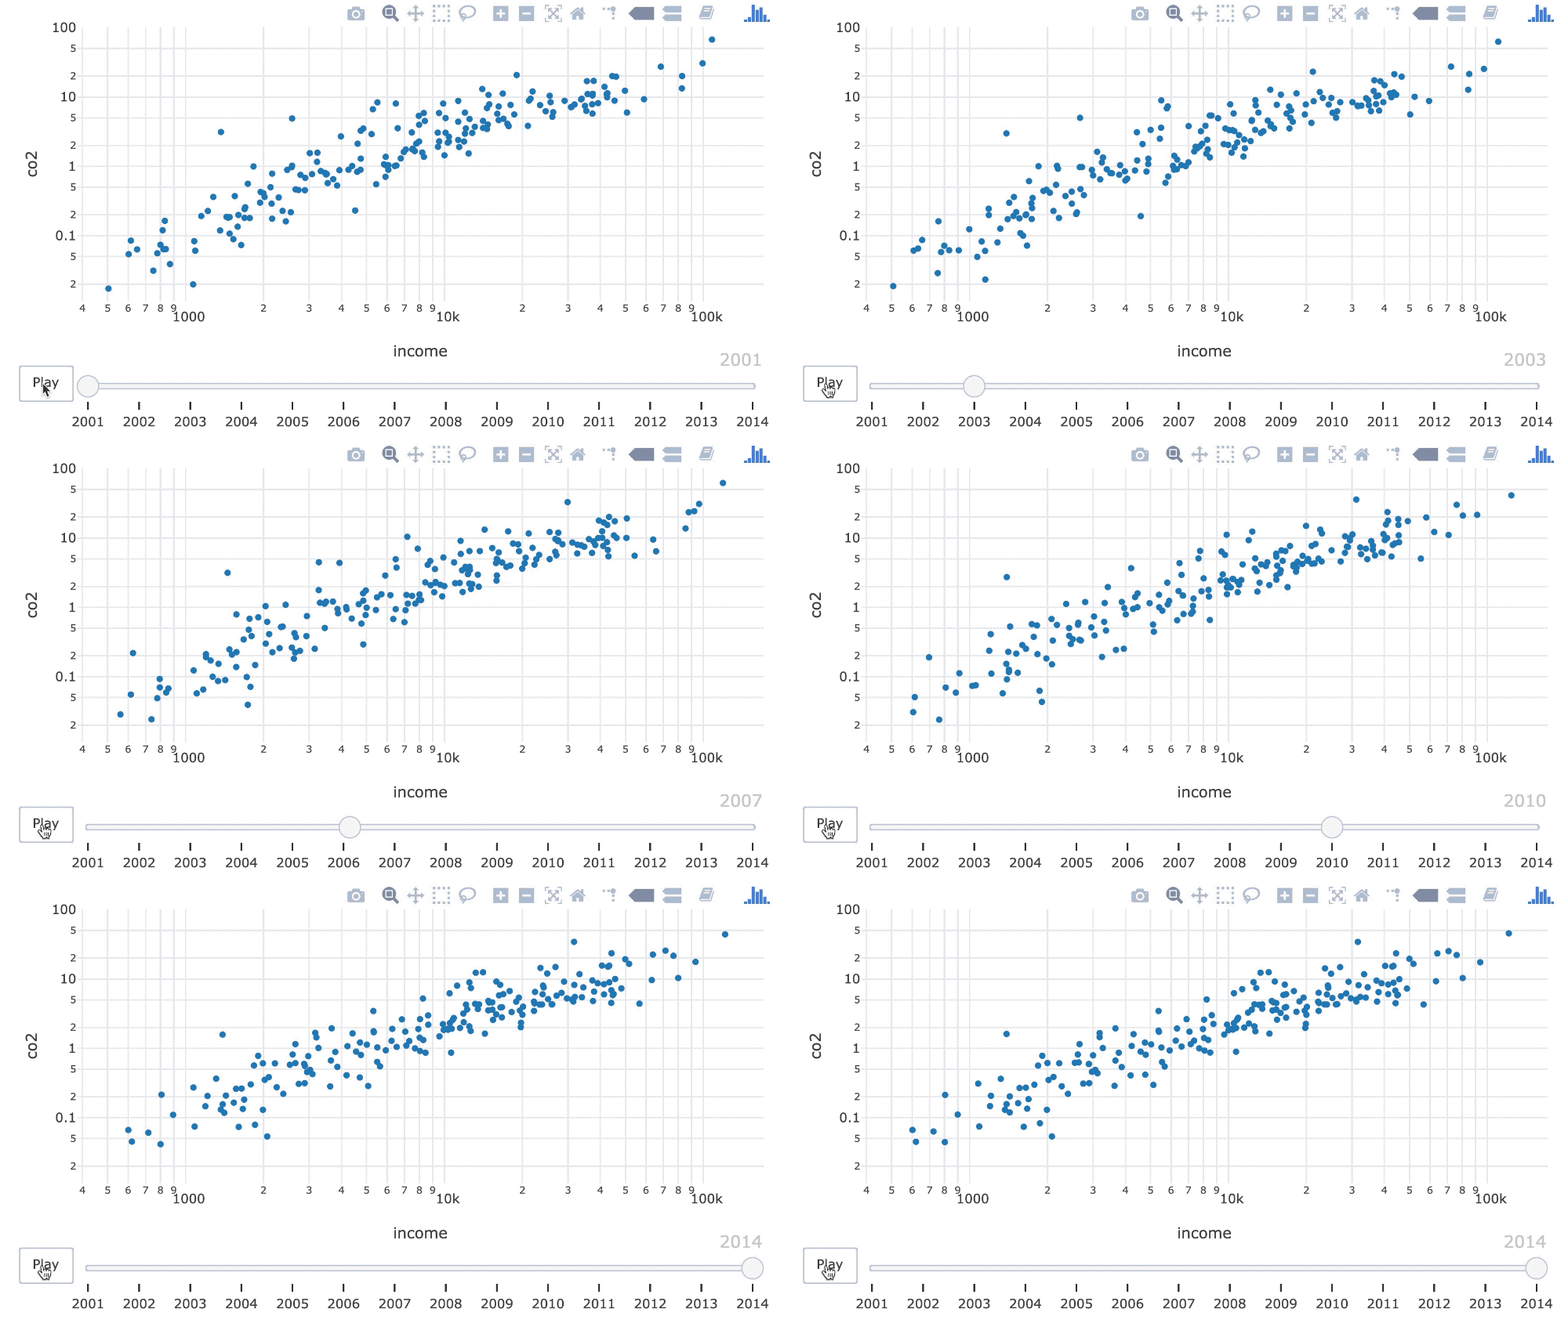
डिफ़ॉल्ट सेटिंग्स के साथ बेसिक एनिमेशन.

ani
इंटरमीडिएट इंटरएक्टिव डेटा विज़ुअलाइज़ेशन with plotly in R

स्लाइडर हटाना

स्लाइडर के बिना एनिमेशन.

ani %>%
  animation_slider(hide = TRUE)
इंटरमीडिएट इंटरएक्टिव डेटा विज़ुअलाइज़ेशन with plotly in R

स्लाइडर टेक्स्ट संपादित करना

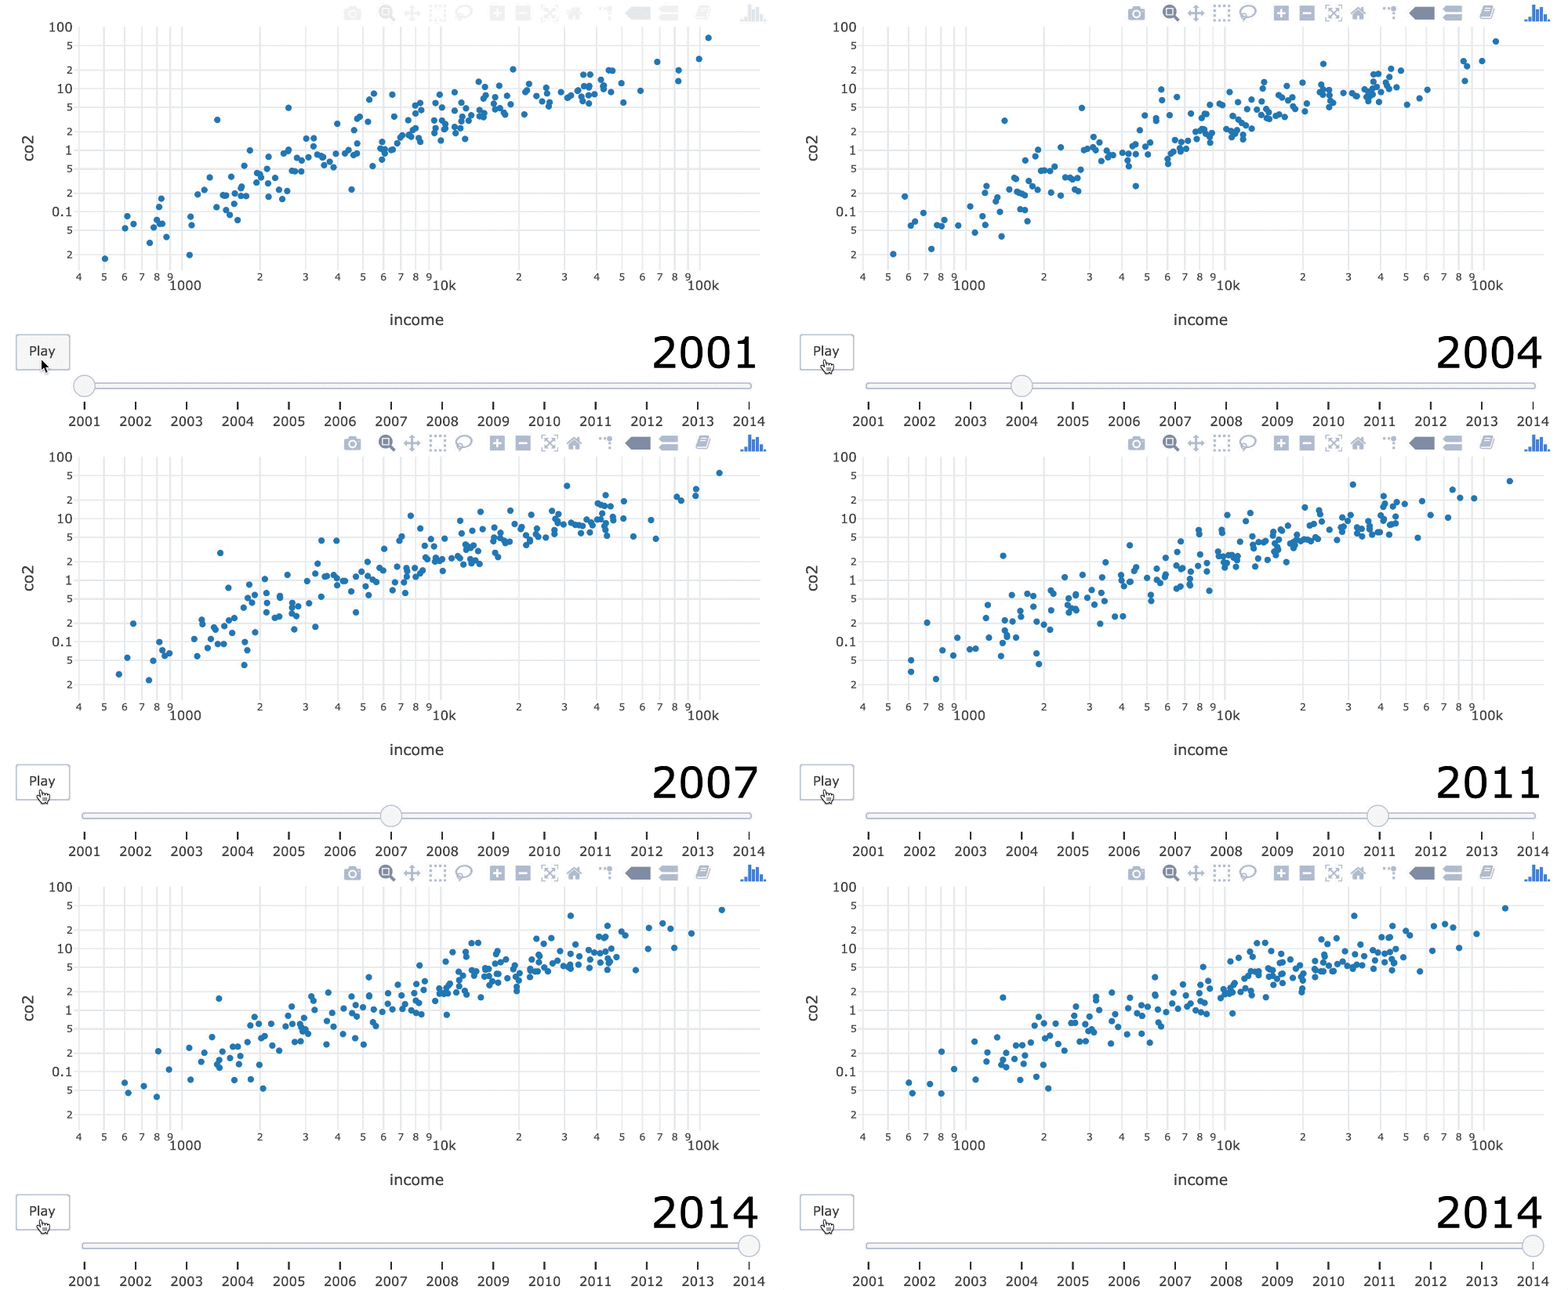
स्लाइडर से "year: " प्रीफ़िक्स हटाना.

ani %>%
  animation_slider(
     currentvalue = list(prefix=NULL)
  )
इंटरमीडिएट इंटरएक्टिव डेटा विज़ुअलाइज़ेशन with plotly in R

स्लाइडर टेक्स्ट संपादित करना

स्लाइडर टेक्स्ट साइज 40 करना और रंग काला करना.

ani %>%
  animation_slider(
     currentvalue = list(prefix=NULL,
        font = list(
           color = "black", 
           size = 40
        )
     )
  )
इंटरमीडिएट इंटरएक्टिव डेटा विज़ुअलाइज़ेशन with plotly in R

अभ्यास करते हैं!

इंटरमीडिएट इंटरएक्टिव डेटा विज़ुअलाइज़ेशन with plotly in R

Preparing Video For Download...