การทำงานกับข้อมูลเชิงกลุ่มใน Python
Kasey Jones
Research Data Scientist
reviews
reviews.info()
RangeIndex: 504 entries, 0 to 503
Data columns (total 20 columns):
 #   Column             Non-Null Count  Dtype
     ------             --------------  -----
 0   User country       504 non-null    object
...
 6   Traveler type      504 non-null    object
 7   Pool               504 non-null    object
 8   Gym                504 non-null    object
 9   Tennis court       504 non-null    object
...
dtypes: int64(7), object(13)
memory usage: 78.9+ KB
Categorical plots:
import seaborn as sns
import matplotlib.pyplot as plt

sns.catplot(...)
plt.show()
พารามิเตอร์:
x
data
y
kind
"strip"
"swarm"
"box"
"violin"
"boxen"
"point"
"bar"
"count"
หน้า Wikipedia เกี่ยวกับ Box plot
reviews["Score"].value_counts()
5    227
4    164
3     72
2     30
1     11
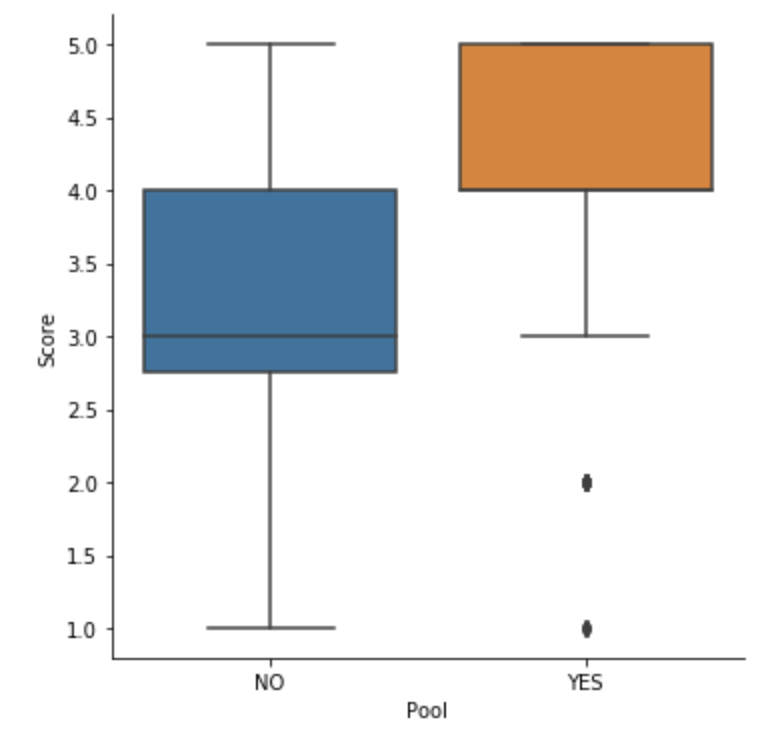
sns.catplot(
  x="Pool",
  y="Score",
  data=reviews,
  kind="box"
)
plt.show()
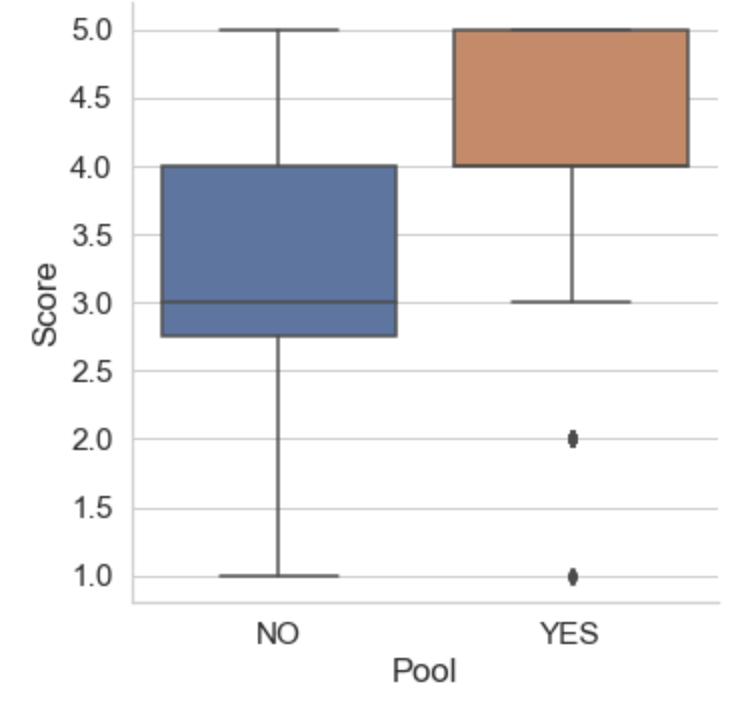
# Setting font size and plot background
sns.set(font_scale=1.4)

sns.set_style("whitegrid")
# Setting font size and plot background sns.set(font_scale=1.4)
sns.set_style("whitegrid")