Bar plot ใน Seaborn

การทำงานกับข้อมูลเชิงกลุ่มใน Python

Kasey Jones

Research Data Scientist

Bar chart แบบดั้งเดิม

# Code provided for clarity
reviews["Traveler type"].value_counts().plot.bar()
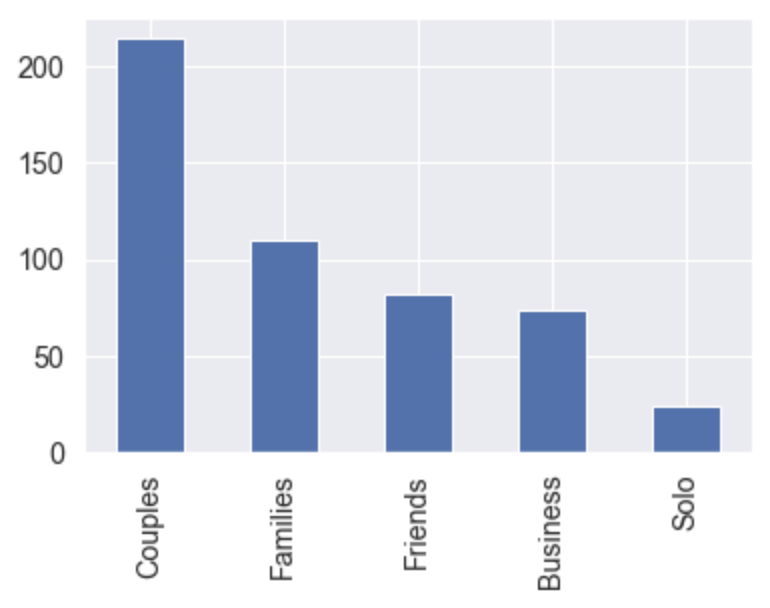
Bar chart แสดงจำนวนรีวิวแยกตามประเภทนักเดินทาง

การทำงานกับข้อมูลเชิงกลุ่มใน Python

ไวยากรณ์การใช้งาน

sns.set(font_scale=1.3)
sns.set_style("darkgrid")

sns.catplot(x="Traveler type", y="Score", data=reviews, kind="bar")
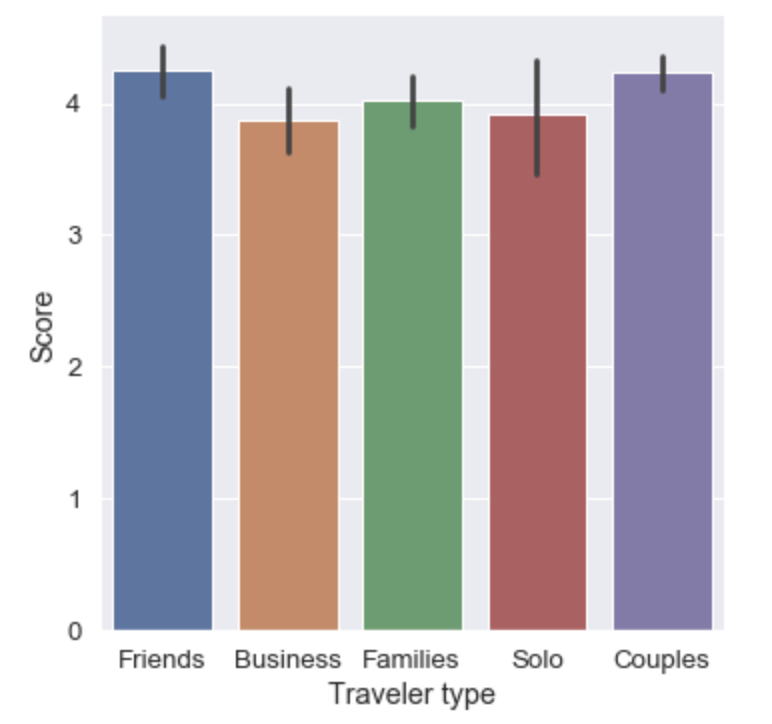
Bar plot เชิงหมวดหมู่ใน Seaborn แสดงคะแนนรีวิวโรงแรมตามประเภทนักเดินทาง

การทำงานกับข้อมูลเชิงกลุ่มใน Python

การจัดลำดับหมวดหมู่

reviews["Traveler type"] = reviews["Traveler type"].astype("category")
reviews["Traveler type"].cat.categories
Index(['Business', 'Couples', 'Families', 'Friends', 'Solo'], dtype='object')
การทำงานกับข้อมูลเชิงกลุ่มใน Python

การแสดงผลที่อัปเดตแล้ว

sns.catplot(x="Traveler type", y="Score", data=reviews, kind="bar")
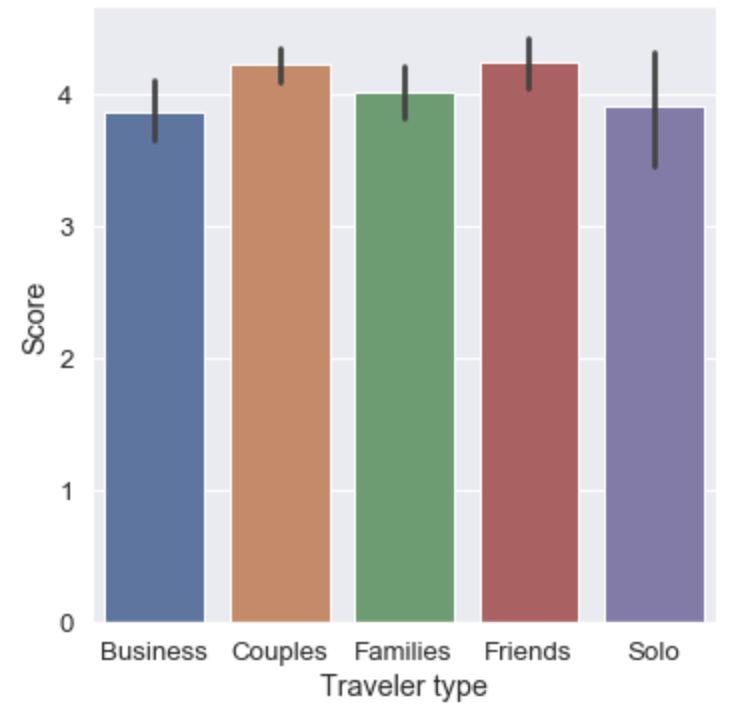
  • หมายเหตุ: catplot() มีพารามิเตอร์ order
การทำงานกับข้อมูลเชิงกลุ่มใน Python

พารามิเตอร์ hue

  • hue:
    • ชื่อตัวแปรใน data
    • ใช้แบ่งข้อมูลตามหมวดหมู่ที่สอง
    • ใช้กำหนดสีของกราฟด้วย
sns.set(font_scale=1.2)
sns.set_style("darkgrid")
sns.catplot(x="Traveler type", y="Score", data=reviews, kind="bar",
            hue="Tennis court")  # <--- new parameter
การทำงานกับข้อมูลเชิงกลุ่มใน Python

Bar plot สองตัวแปร

การทำงานกับข้อมูลเชิงกลุ่มใน Python

ฝึกสร้าง Bar plot

การทำงานกับข้อมูลเชิงกลุ่มใน Python

Preparing Video For Download...