Structuredness
Business Process Analytics in R

Gert Janssenswillen
Creator of bupaR
Control-flow
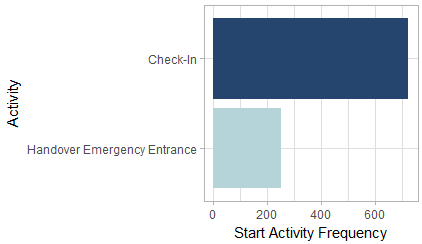
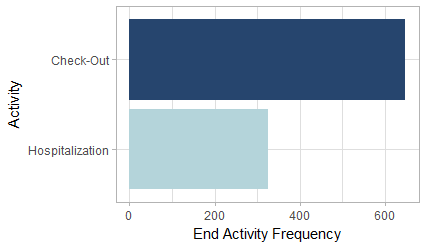
Entry & Exit points
log_healthcare %>%
    start_activities("activity") %>%
    plot()
log_healthcare %>%
    end_activities("activity") %>%
    plot()
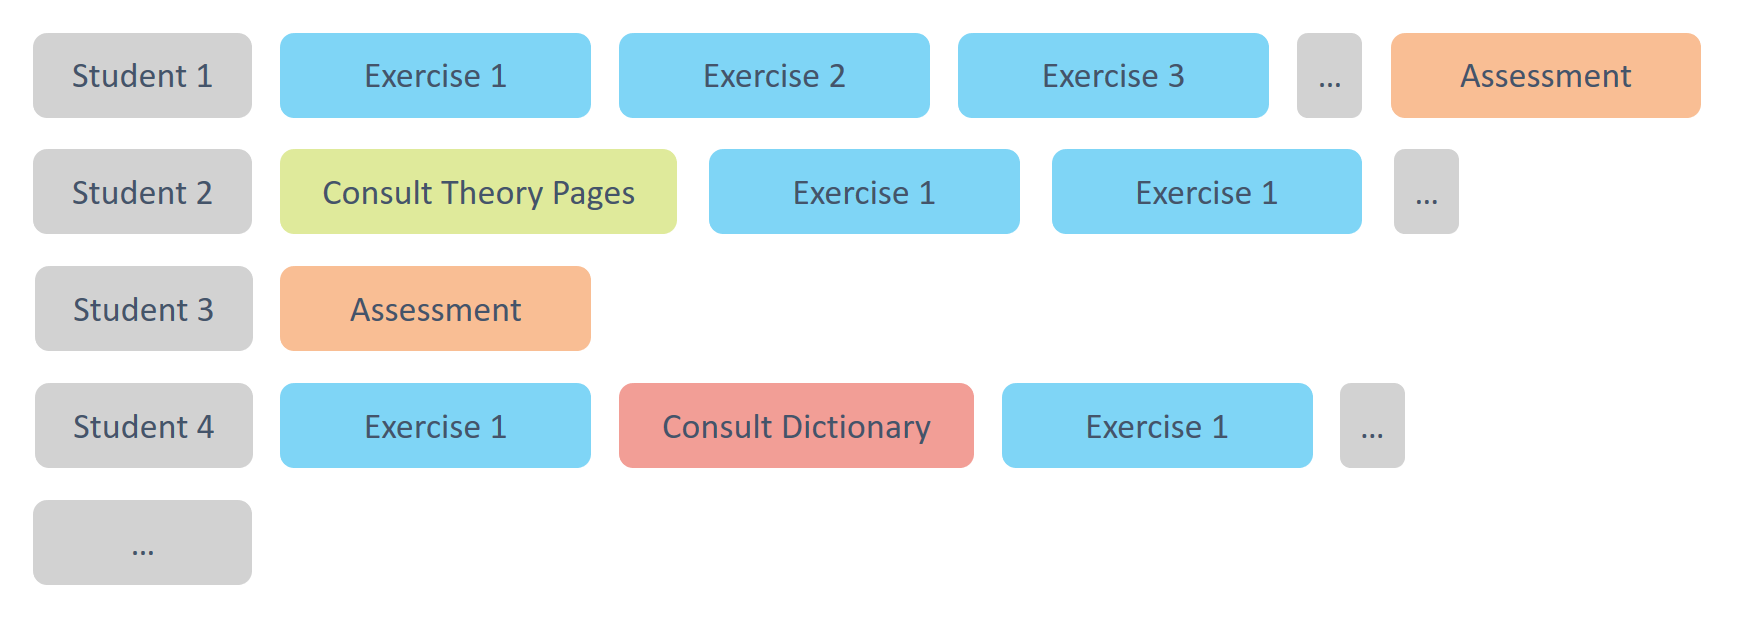
Rework
An example patient history

- Repetitions
- Surgery > ... > Surgery
- Self-loop
- Assessment > Assessment
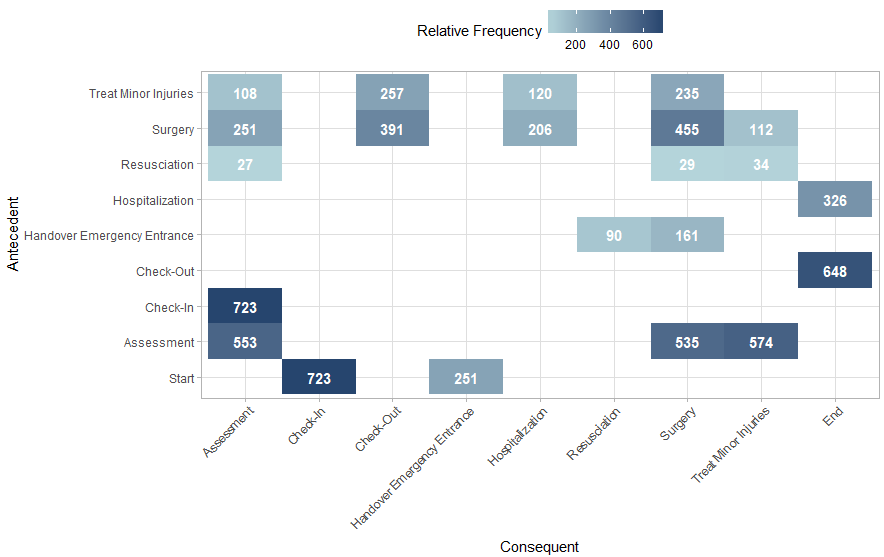
Precedence matrix
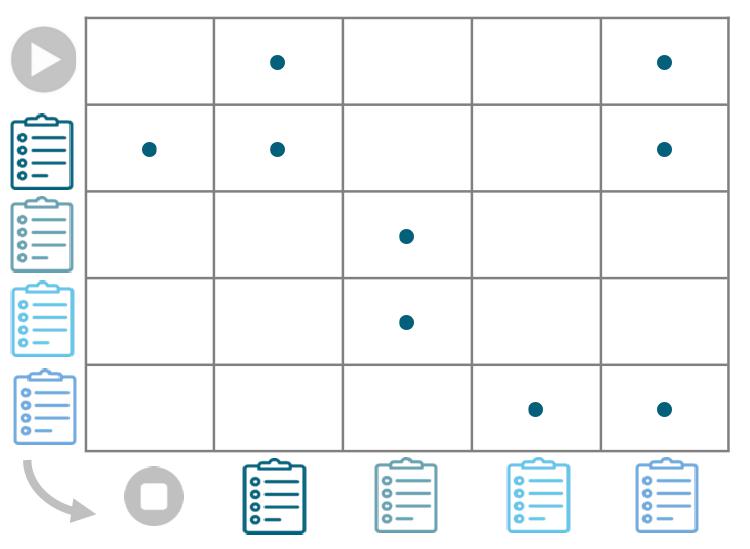
Precedence matrix Example