Activities as cornerstones of processes
Business Process Analytics in R

Gert Janssenswillen
Creator of bupaR
Example: Online learning

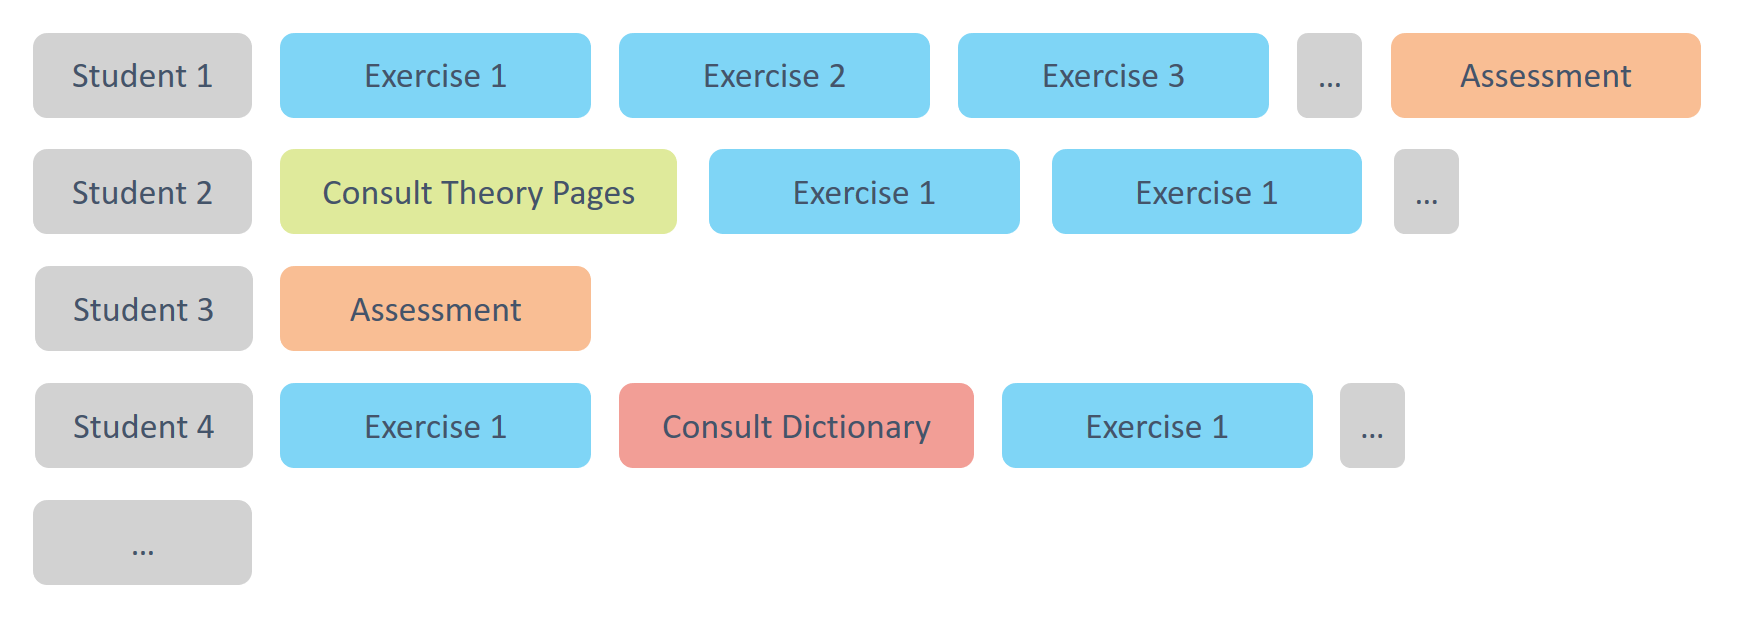
Exploring sequences of activities
Each case is described by a sequence of activities, its trace.
Business Process Analytics in R
Gert Janssenswillen
Creator of bupaR
Each case is described by a sequence of activities, its trace.

