NumPy för bilder
Bildbehandling i Python

Rebeca Gonzalez
Data Engineer
NumPy för bilder
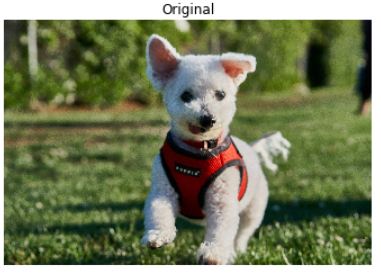
Bilder som NdArrays

# Loading the image using Matplotlib
madrid_image = plt.imread('/madrid.jpeg')

type(madrid_image)
<class 'numpy.ndarray'>
Färger med NumPy
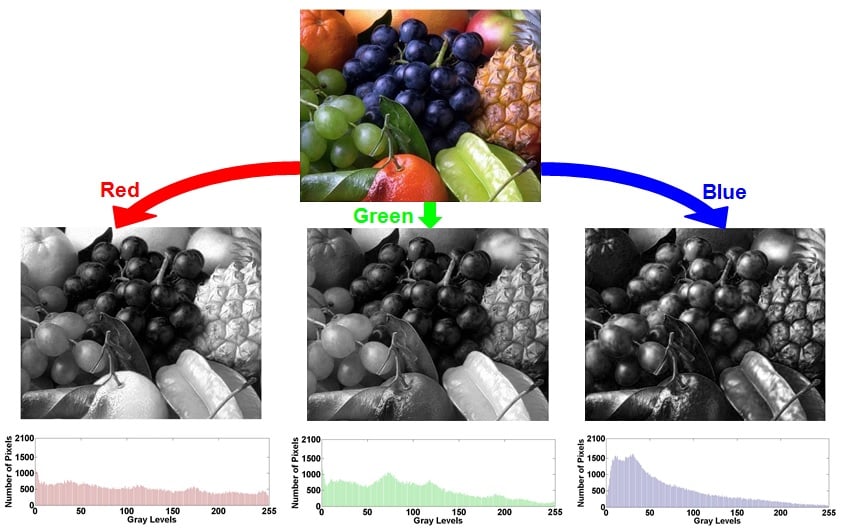
Färger med NumPy
# Obtaining the red values of the image
red = image[:, :, 0]

# Obtaining the green values of the image
green = image[:, :, 1]

# Obtaining the blue values of the image
blue = image[:, :, 2]
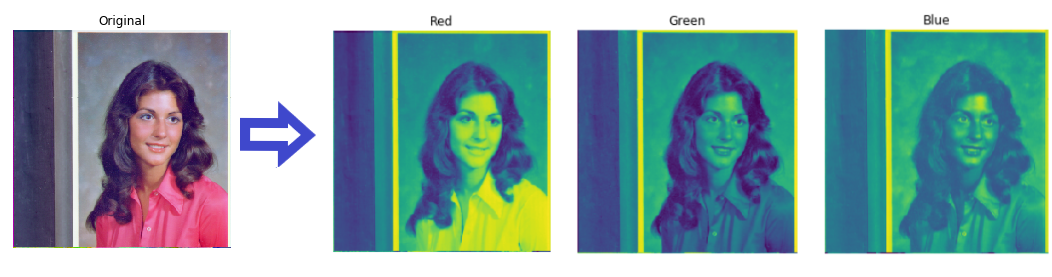
Färger med NumPy
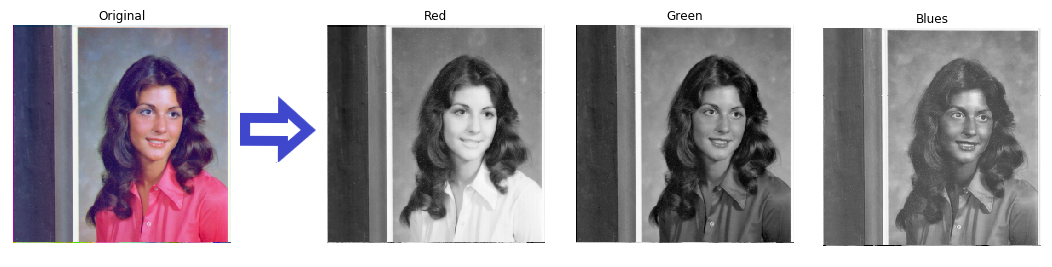
plt.imshow(red, cmap="gray")
plt.title('Red')
plt.axis('off')
plt.show()
Former
# Accessing the shape of the image
madrid_image.shape
(426, 640, 3)
Storlekar
# Accessing the shape of the image
madrid_image.size
817920
Spegla bilder: vertikalt
# Flip the image in up direction
vertically_flipped = np.flipud(madrid_image)

show_image(vertically_flipped, 'Vertically flipped image')

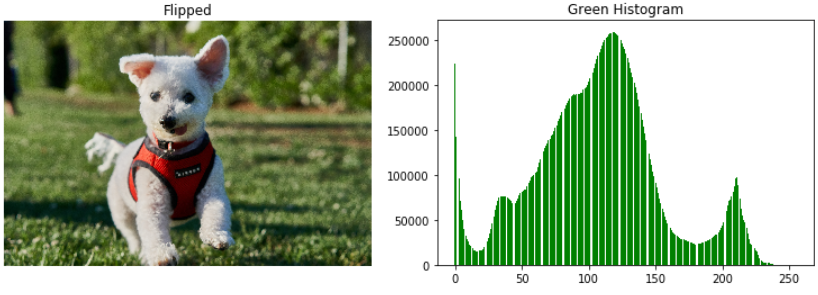
Spegla bilder: horisontellt
# Flip the image in left direction
horizontally_flipped = np.fliplr(madrid_image)

show_image(horizontally_flipped, 'Horizontally flipped image')

Vad är ett histogram?
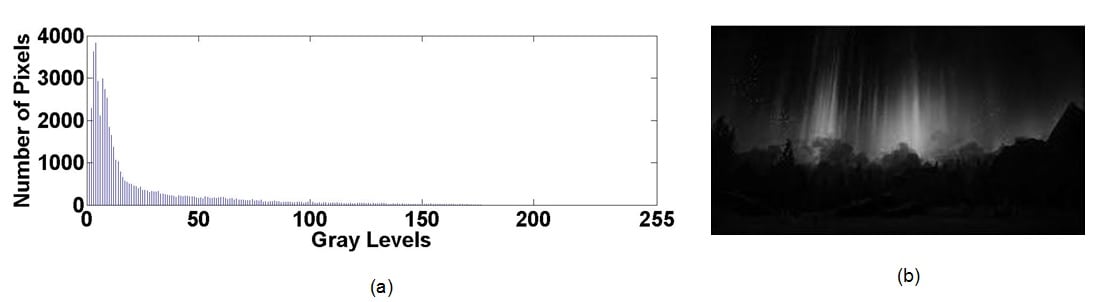
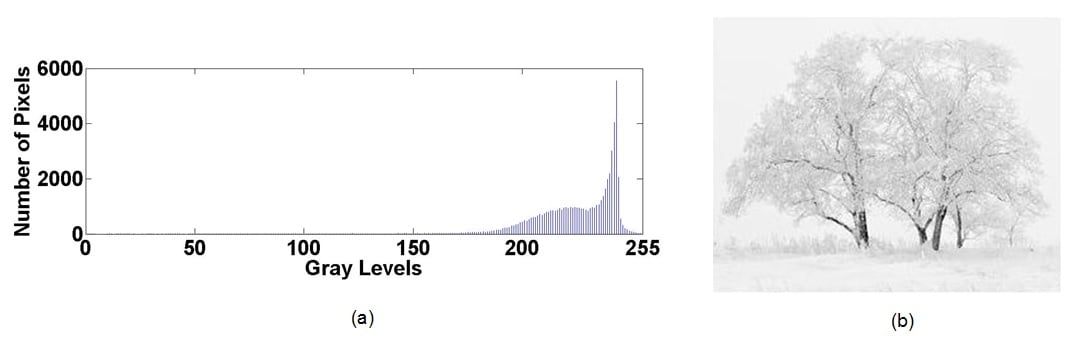
Färghistogram

Användningsområden för histogram
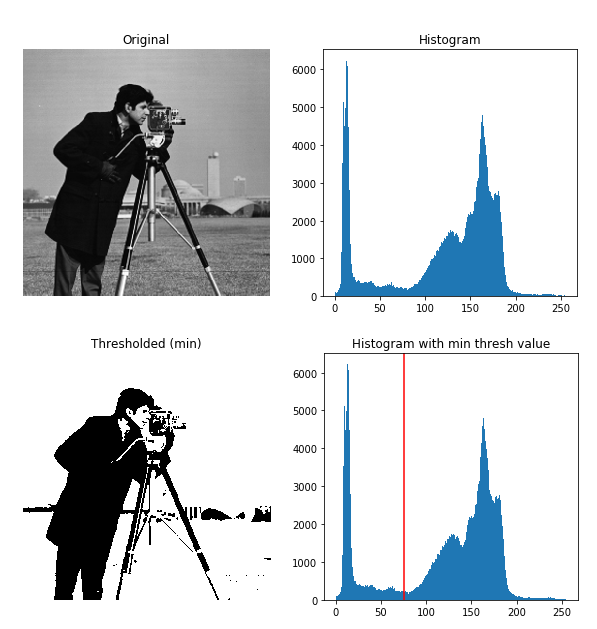
Histogram i Matplotlib
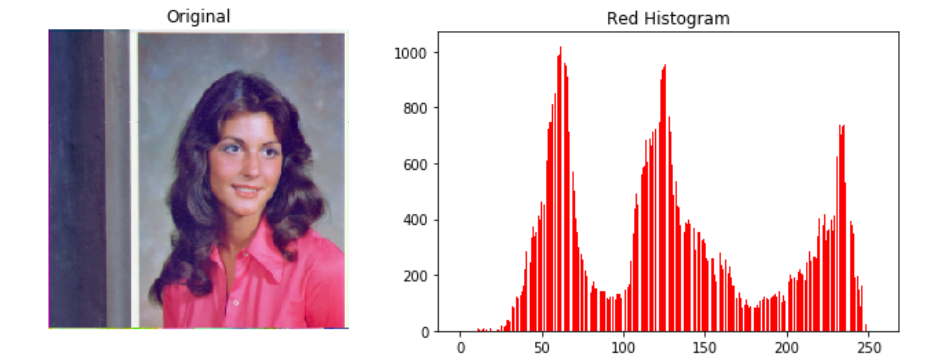
# Red color of the image red = image[:, :, 0]# Obtain the red histogram plt.hist(red.ravel(), bins=256)
Visualisera histogram med Matplotlib
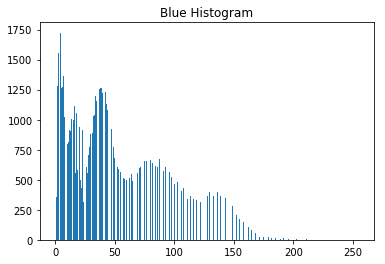
blue = image[:, :, 2]

plt.hist(blue.ravel(), bins=256)
plt.title('Blue Histogram')
plt.show()