Subplots

Introduktion till datavisualisering med Plotly i Python

Alex Scriven

Data Scientist

Vad är subplots?
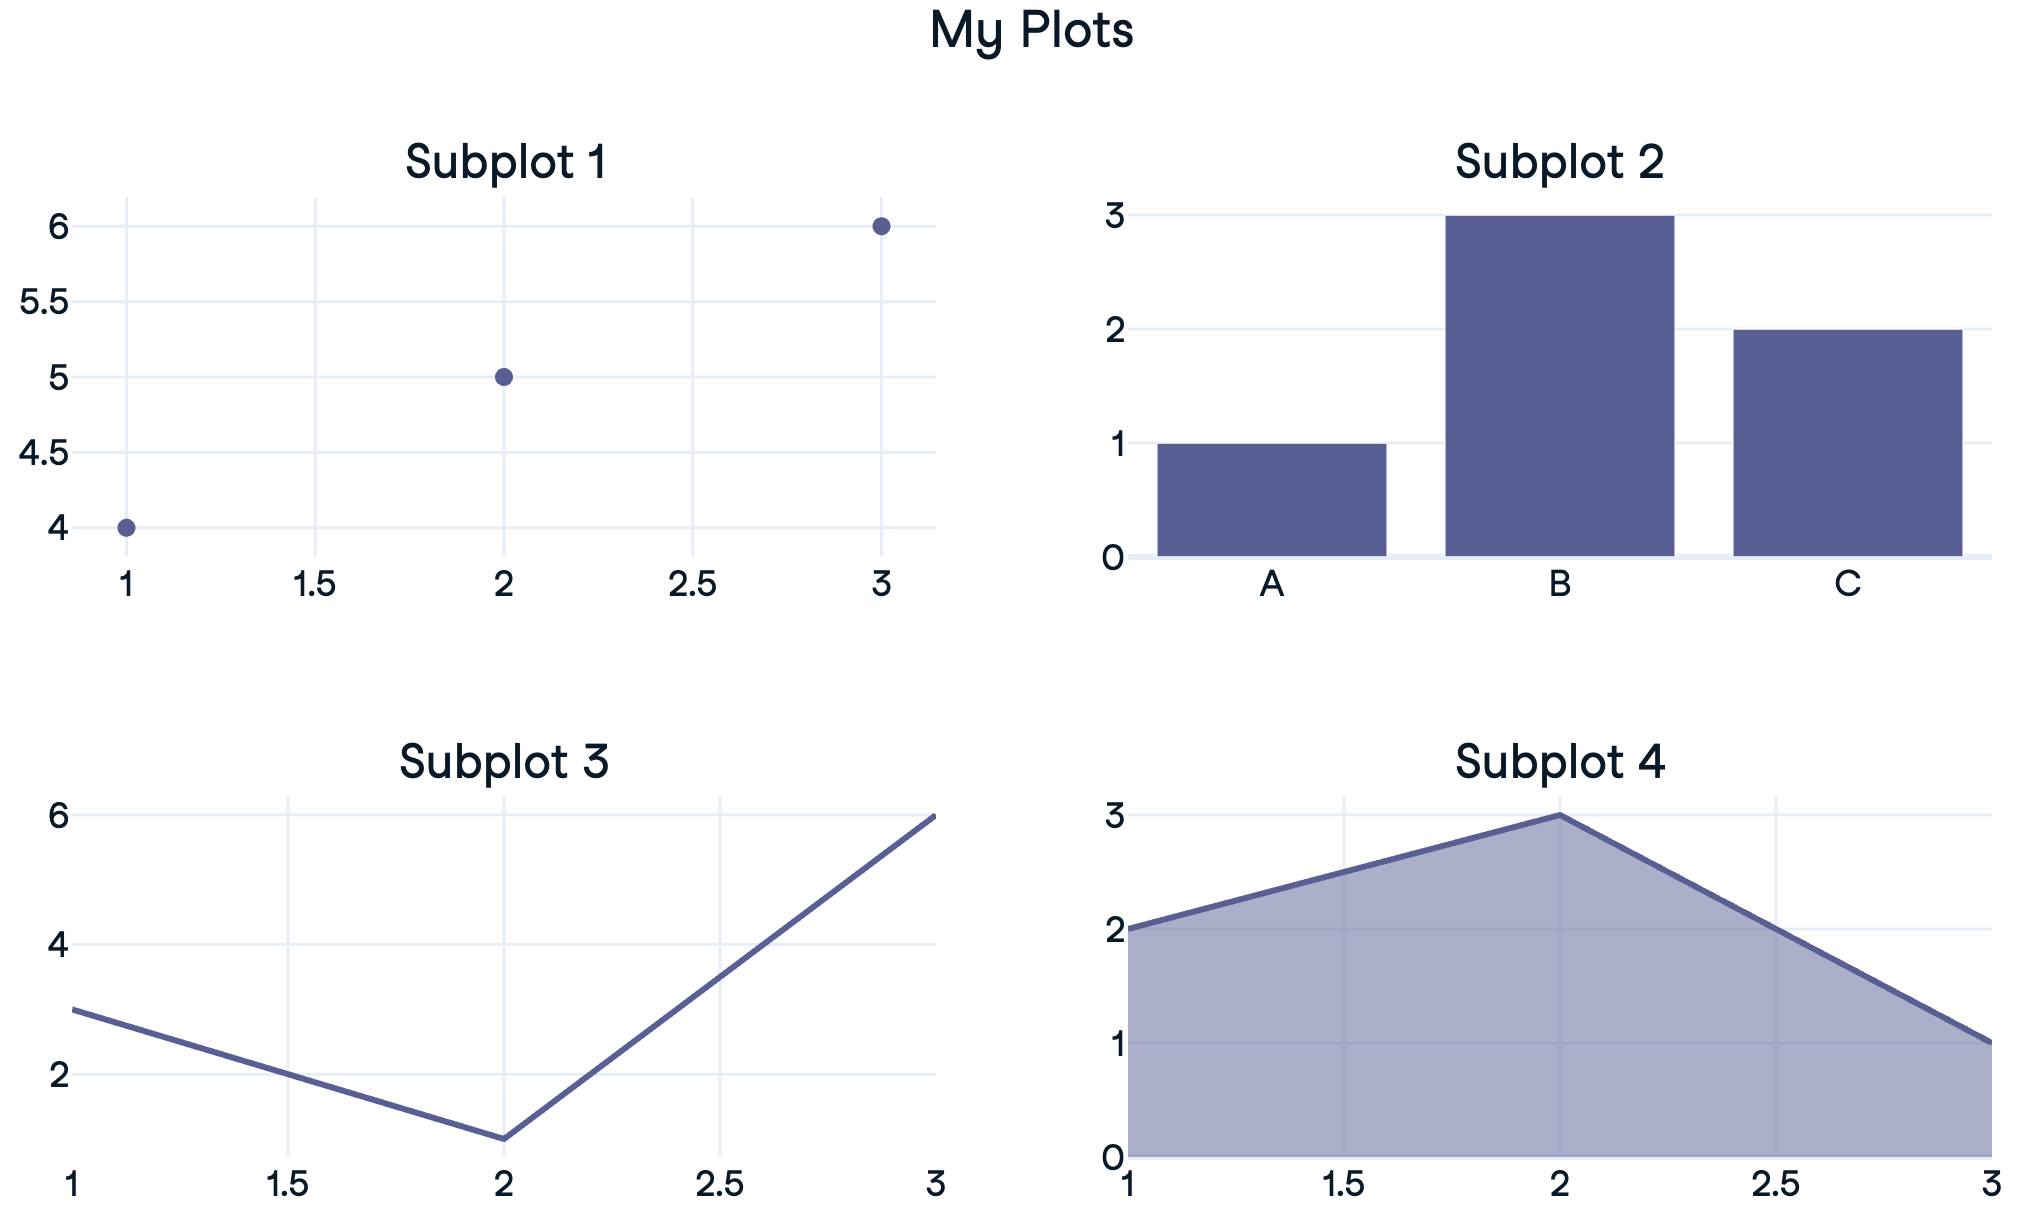
 

  • Subplots: 'mini-diagram' placerade i ett rutnät

$$

  • Visar olika diagramtyper (samma data) eller olika delmängder av data


Översikt över subplots

Introduktion till datavisualisering med Plotly i Python

En påminnelse om traces


  • Plotly-figurer innehåller en lista med traces – data och diagramtyp

  • Nås via fig.data[0], fig.data[1]

    • Läggs till i subplots med .add_trace()

$$

px_fig = px.scatter(df...)
print(px_fig)
Figure({'data': [trace1], 'layout': {...}})
Introduktion till datavisualisering med Plotly i Python

Skapa ett 1x2-subplot

import plotly.express as px
from plotly.subplots import make_subplots

# Create a subplot grid
fig = make_subplots(rows=2, cols=1)

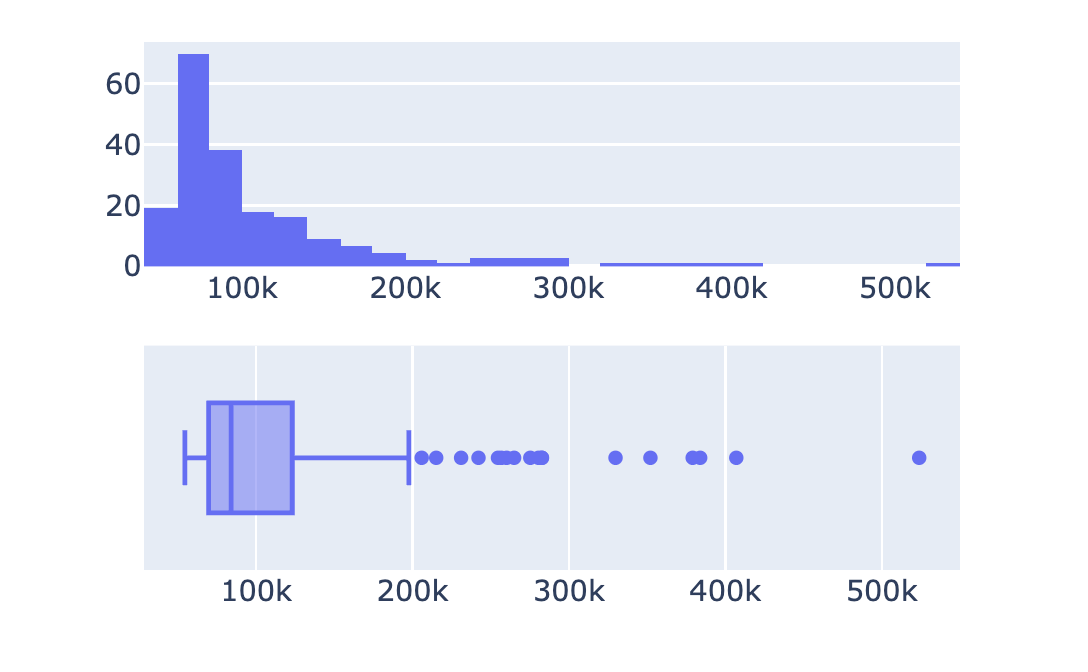
# Create plotly express figures hist = px.histogram(revenues, x='Revenue') box = px.box(revenues, x='Revenue')
# Extract traces and add to subplots fig.add_trace(hist.data[0], row=1, col=1) fig.add_trace(box.data[0], row=2, col=1) fig.show()


Ett finansiellt subplot

Introduktion till datavisualisering med Plotly i Python

Anpassa subplots


  • Ingen övergripande diagramtitel
  • Inga subplot-titlar

$$

$$

$$

  • ✨ Gör det presentationsklart


Enkelt finansiellt subplot

Introduktion till datavisualisering med Plotly i Python

Subplot-titlar

from plotly.subplots import make_subplots

fig = make_subplots(rows=2, cols=1,
    subplot_titles=[
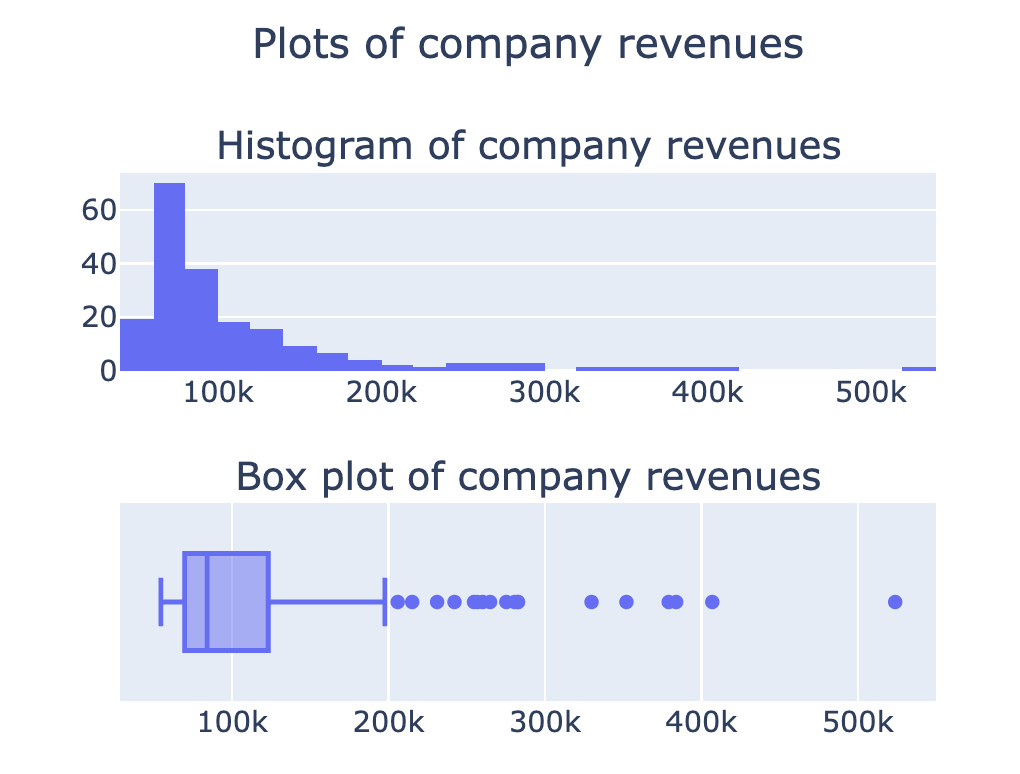
    'Histogram of company revenues', 
    'Box plot of company revenues'])

## Add in traces (fig.add_trace())
fig.update_layout({'title': {'text': 'Plots of company revenues', 'x': 0.5, 'y': 0.9}}) fig.show()

Subplot-titlar fixade

Fler alternativ i dokumentationen

Introduktion till datavisualisering med Plotly i Python

Staplade subplots

$$

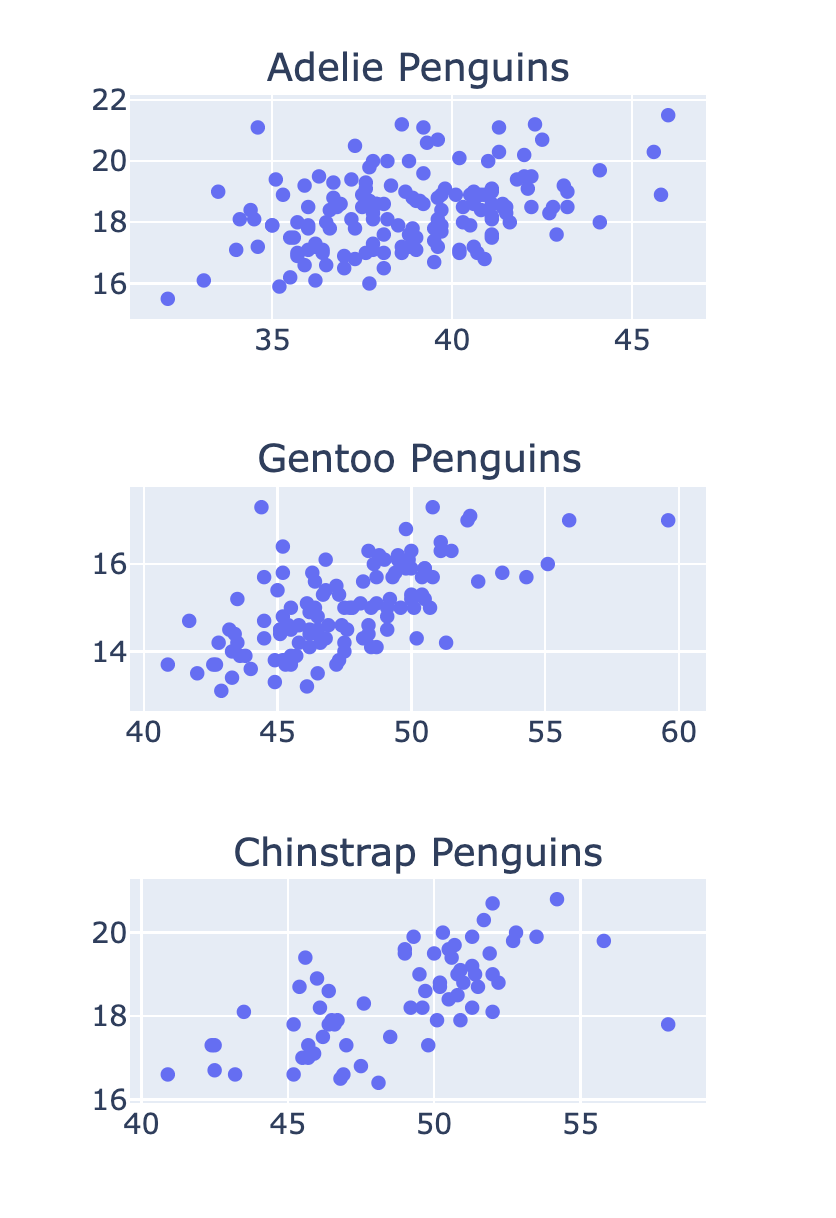
fig = make_subplots(rows=3, cols=1, 
  subplot_titles=['Adelie Penguins'
  , 'Gentoo Penguins', 'Chinstrap Penguins'])

row_num = 1 for species in ['Adelie', 'Gentoo', 'Chinstrap']: # Filter data for this species df = penguins[penguins['Species'] == species]
scatter = px.scatter(df, x='Culmen Length (mm)' , y='Culmen Depth (mm)') # Add the trace to the subplot fig.add_trace(scatter.data[0] , row=row_num, col=1) row_num +=1

Staplade pingvin-subplots

Introduktion till datavisualisering med Plotly i Python

Subplots med delade axlar


  • Gör x-axeln delad:
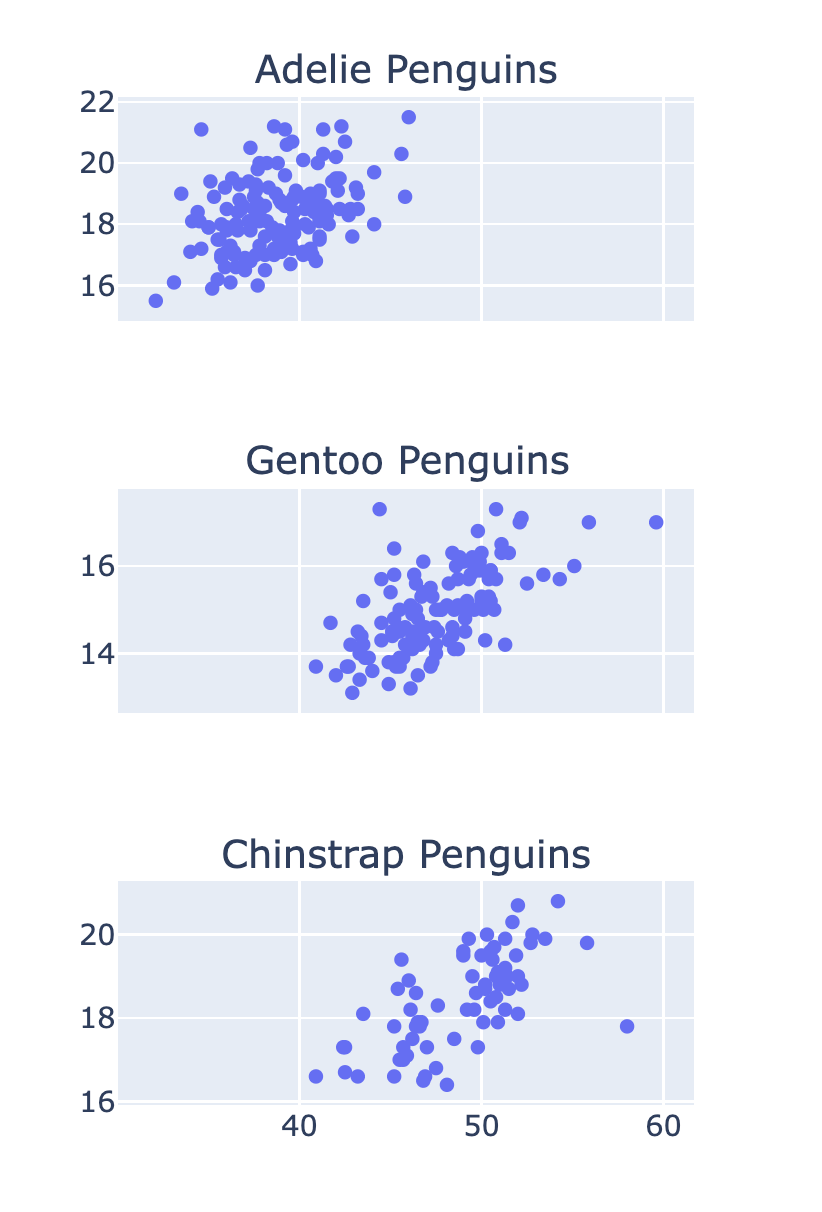
fig = make_subplots(
    rows=3, cols=1
    , shared_xaxes=True)

Pingvin-subplots med delad x-axel

Introduktion till datavisualisering med Plotly i Python

Nu kör vi en övning!

Introduktion till datavisualisering med Plotly i Python

Preparing Video For Download...