การเพิ่ม annotation

การแสดงผลข้อมูลด้วย Plotly ใน Python

Alex Scriven

Data Scientist

annotation คืออะไร?

  • กล่องข้อความและข้อมูลที่เพิ่มเข้าไปในกราฟ

$$

  1. ดึงความสนใจไปยังจุดข้อมูลที่ต้องการ
  2. เพิ่มหมายเหตุในกราฟ

annotation ที่เชื่อมกับข้อมูล

การแสดงผลข้อมูลด้วย Plotly ใน Python

การสร้าง annotation

$$

  • ใช้ add_annotation()
    • เพิ่ม annotation เดียว

$$

  • ใช้ update_layout() และอาร์กิวเมนต์ annotations
    • รับรายการของออบเจ็กต์ annotation
การแสดงผลข้อมูลด้วย Plotly ใน Python

อาร์กิวเมนต์สำคัญของ annotation

  • text - ข้อความที่จะแสดงผล
    • สามารถใส่ตัวแปรได้

$$

  • x และ y: ระบุตำแหน่งของ annotation

$$

  • showarrow = True/False - ใช้แสดงหรือซ่อนลูกศร
    • ปรับแต่งลูกศรได้

$$

🛑 ระวังการวาง annotation แบบ absolute — หากข้อมูลเปลี่ยน อาจทับซ้อนกันได้

การแสดงผลข้อมูลด้วย Plotly ใน Python

การกำหนดตำแหน่ง annotation


  • โดยค่าเริ่มต้น x และ y อ้างอิงถึงค่าข้อมูลในกราฟ

$$

  • กำหนด xref และ yref เป็น paper เพื่อวาง annotation แบบ absolute
    • x และ y จะเป็นเปอร์เซ็นต์จาก 0 ถึง 1 ของพื้นที่กราฟ
    • (x=0.5, y=0.5) คือจุดกึ่งกลางของกราฟ
การแสดงผลข้อมูลด้วย Plotly ใน Python

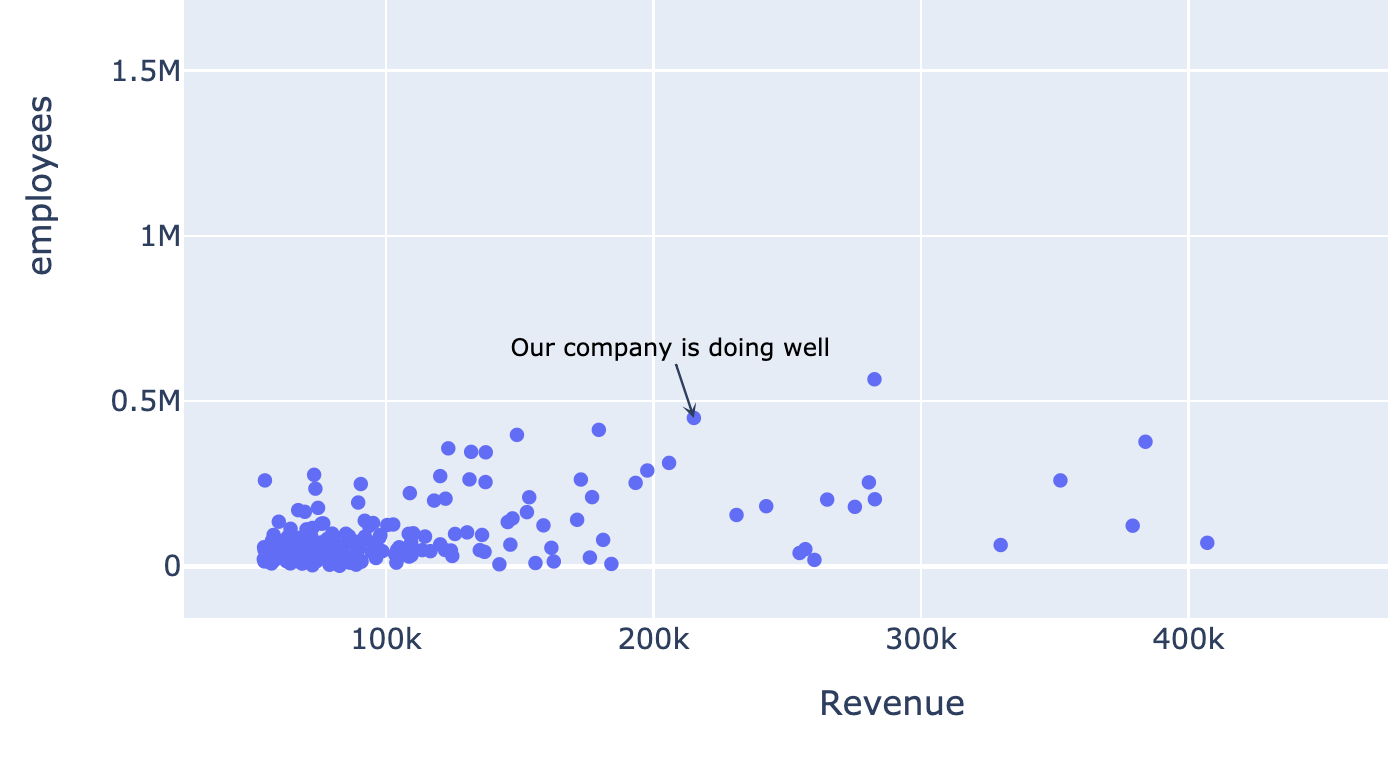
annotation แบบเชื่อมข้อมูล


  • ไฮไลต์บริษัทใน scatterplot
my_annotation = dict(
    x=215111, y=449000,

showarrow=True, arrowhead=3,
text="Our company is doing well", font=dict(size=10, color="black") )
fig.update_layout(annotations=[my_annotation]) fig.show()


$$

annotation ที่เชื่อมกับข้อมูล

การแสดงผลข้อมูลด้วย Plotly ใน Python

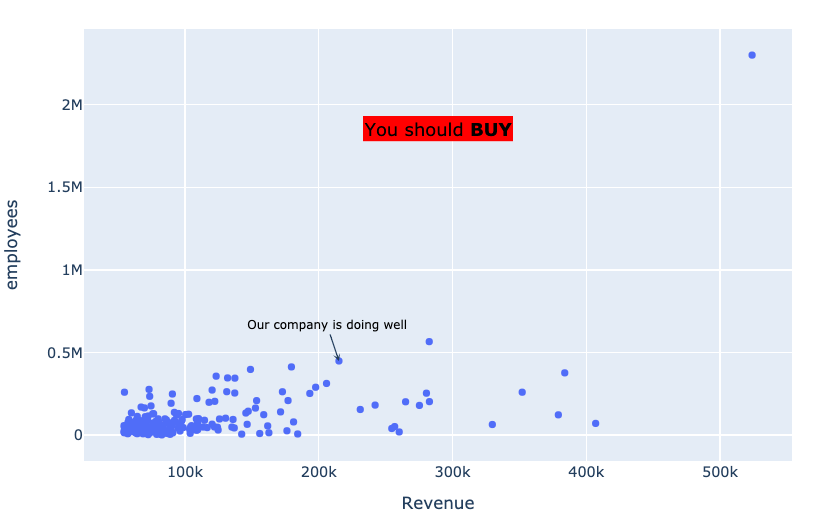
annotation แบบลอย

$$

float_annotation = dict(
    xref="paper", yref="paper",

x=0.5, y=0.8,
showarrow=False, text="You should <b>BUY</b>", font=dict(size=15, color="black"), bgcolor="rgb(255,0,0)" )


annotation แบบลอย

การแสดงผลข้อมูลด้วย Plotly ใน Python

มาฝึกกันเถอะ!

การแสดงผลข้อมูลด้วย Plotly ใน Python

Preparing Video For Download...