การแสดงผลข้อมูลด้วย Plotly ใน Python
Alex Scriven
Data Scientist
องค์ประกอบเชิงโต้ตอบสำหรับสลับค่าและอัปเดตกราฟ
ใช้สำหรับดูข้อมูลตามเวลา
ใช้กับกลุ่มใดก็ได้
$$
$$
$$
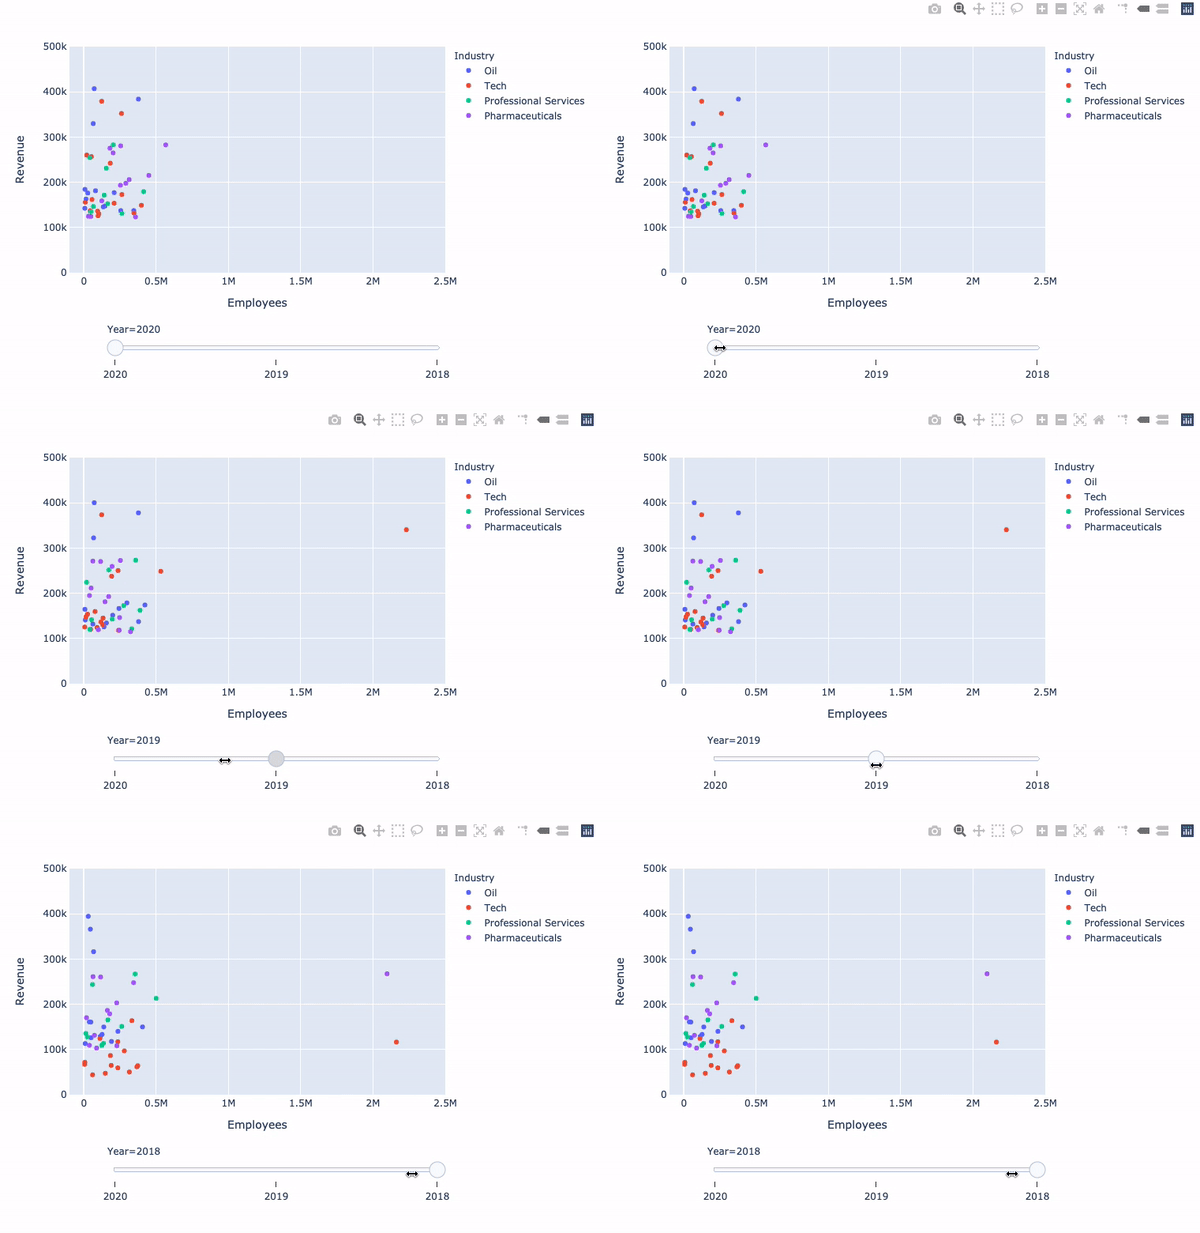
ตัวอย่าง slider แบบปี:

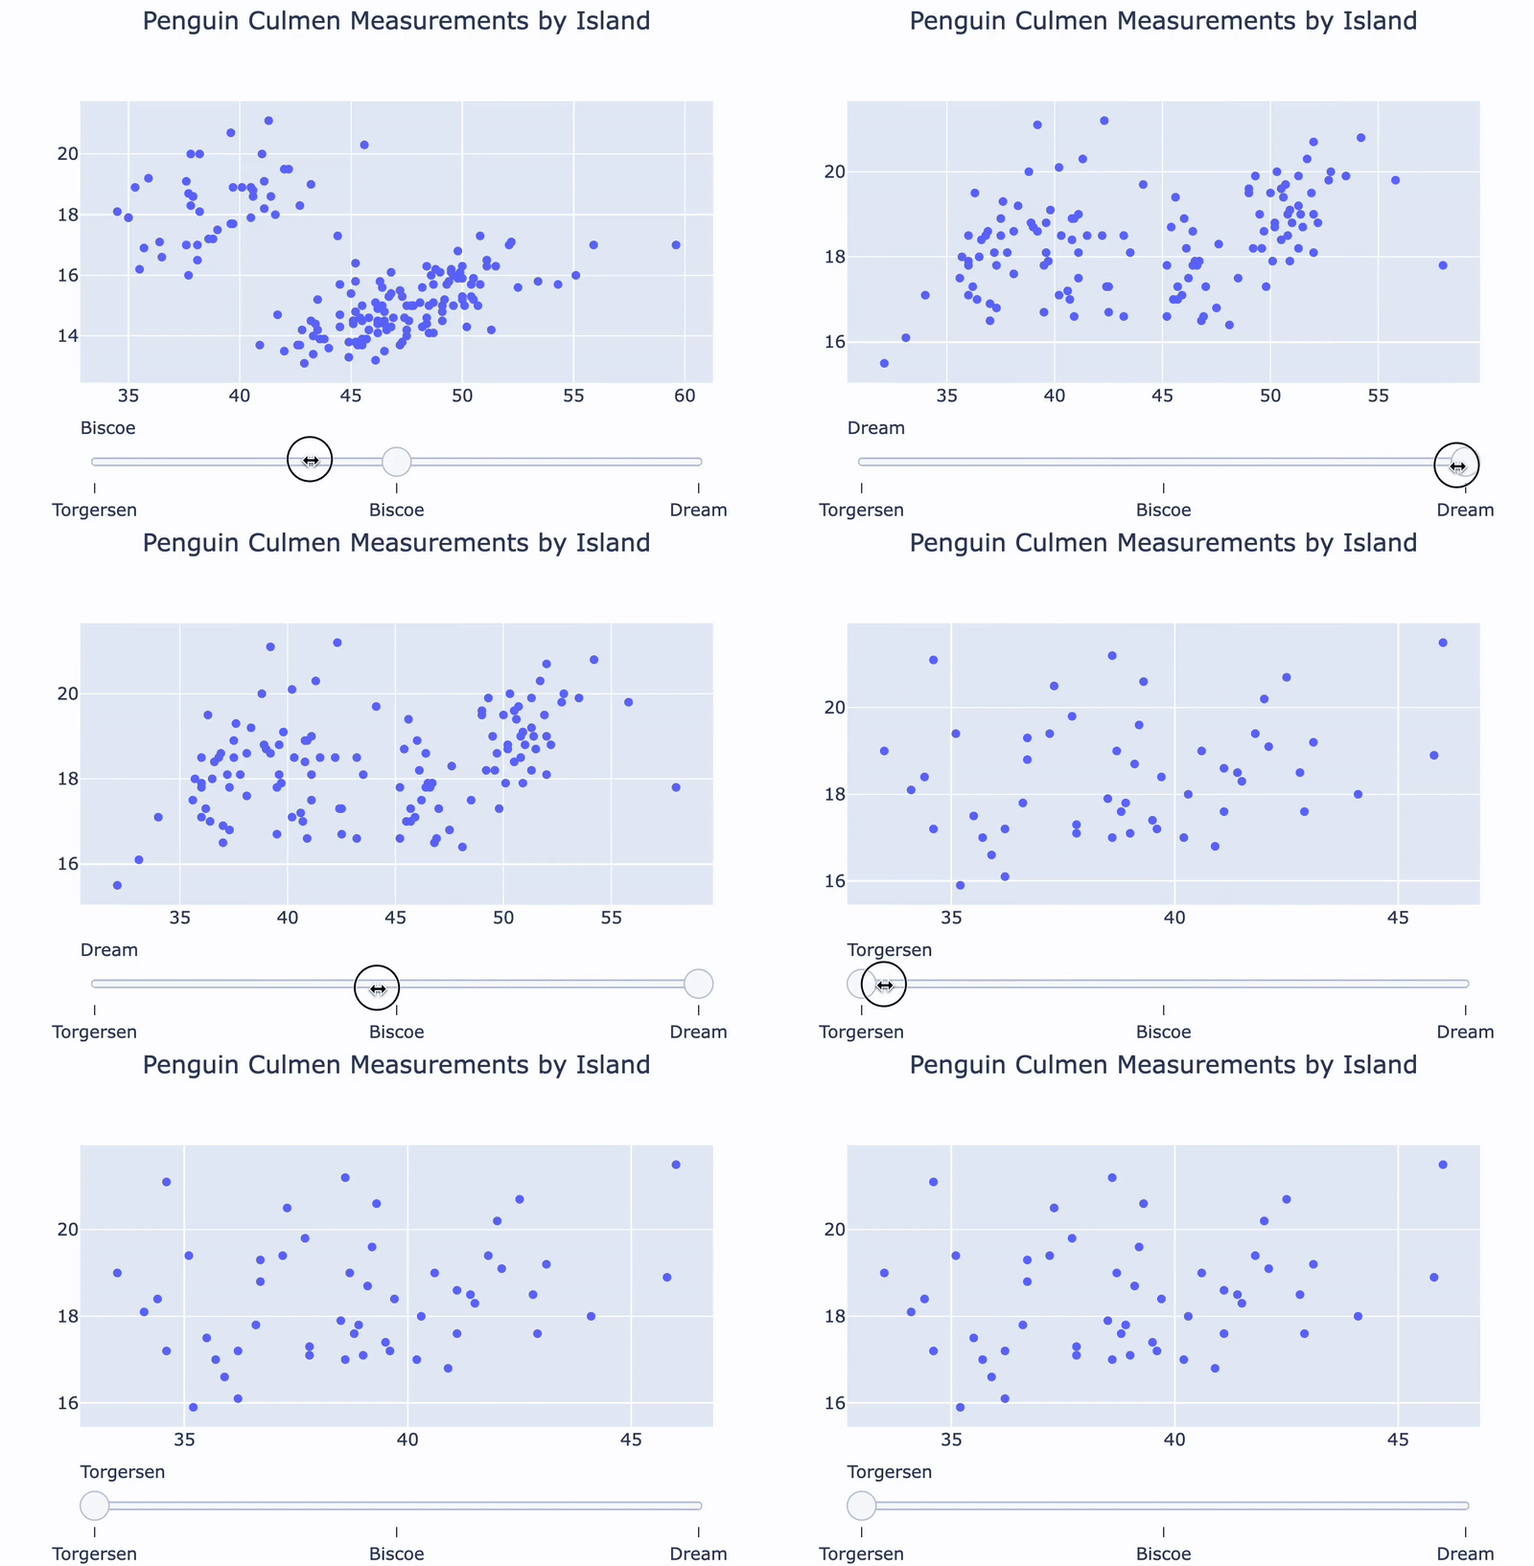
ตัวอย่าง slider แบบเกาะเพนกวิน:

animation_frame กำหนดสิ่งที่จะแสดงบน slider (เช่น Year หรือ Island ในสไลด์ก่อนหน้า)$$
animation_group: ระบุตัวอย่างที่คงที่ข้ามเฟรมfig = px.scatter( data_frame=revenues, y='Revenue', x='Employees', color='Industry',animation_frame='Year', animation_group='Company')fig.update_layout({ 'yaxis': {'range': [0, 500000]}, 'xaxis': {'range': [-100000, 2500000]} })fig['layout'].pop('updatemenus') fig.show()

plotly.express สร้าง slider โดยใช้เมธอด animate
$$
fig['layout']['sliders'][0].steps[0]['method']
animate
$$
fig = go.Figure()for island in ['Torgersen', 'Biscoe', 'Dream']: df = penguins[penguins.Island == island]temp_trace = px.scatter(df, x="Culmen Length (mm)", y="Culmen Depth (mm)") fig.add_trace(temp_trace.data[0])
sliders = [ {'steps':[{'method': 'update', 'label': 'Torgersen','args': [{'visible': [True, False, False]}]},{'method': 'update', 'label': 'Bisco','args': [{'visible': [False, True, False]}]},{'method': 'update', 'label': 'Dream','args': [{'visible': [False, False, True]}]}]} ]
$$
ดูตัวเลือกการจัดรูปแบบเพิ่มเติมได้ในเอกสารประกอบ
$$
fig.update_layout({'sliders': sliders})
fig.show()

การแสดงผลข้อมูลด้วย Plotly ใน Python