การแสดงผลข้อมูลด้วย Plotly ใน Python
Alex Scriven
Data Scientist

Plotly มีข้อดีที่โดดเด่นหลายประการ:
plotly.express
สร้างกราฟ Plotly ได้ด้วยวิธีเหล่านี้:
plotly.express สำหรับพล็อตรวดเร็ว (px)plotly.graph_objects (go) สำหรับการปรับแต่งเพิ่มเติม$$
📈 ส่วนใหญ่จะใช้เวลากับ px
บันทึกลิงก์เอกสารสำคัญเหล่านี้ไว้!
หน้าอ้างอิงเชิงลึก สำหรับพล็อตแต่ละประเภท
$$
สำหรับ Scatter plot:
plotly.express หน้าตัวอย่างตัวอย่าง plotly figure เบื้องต้น:
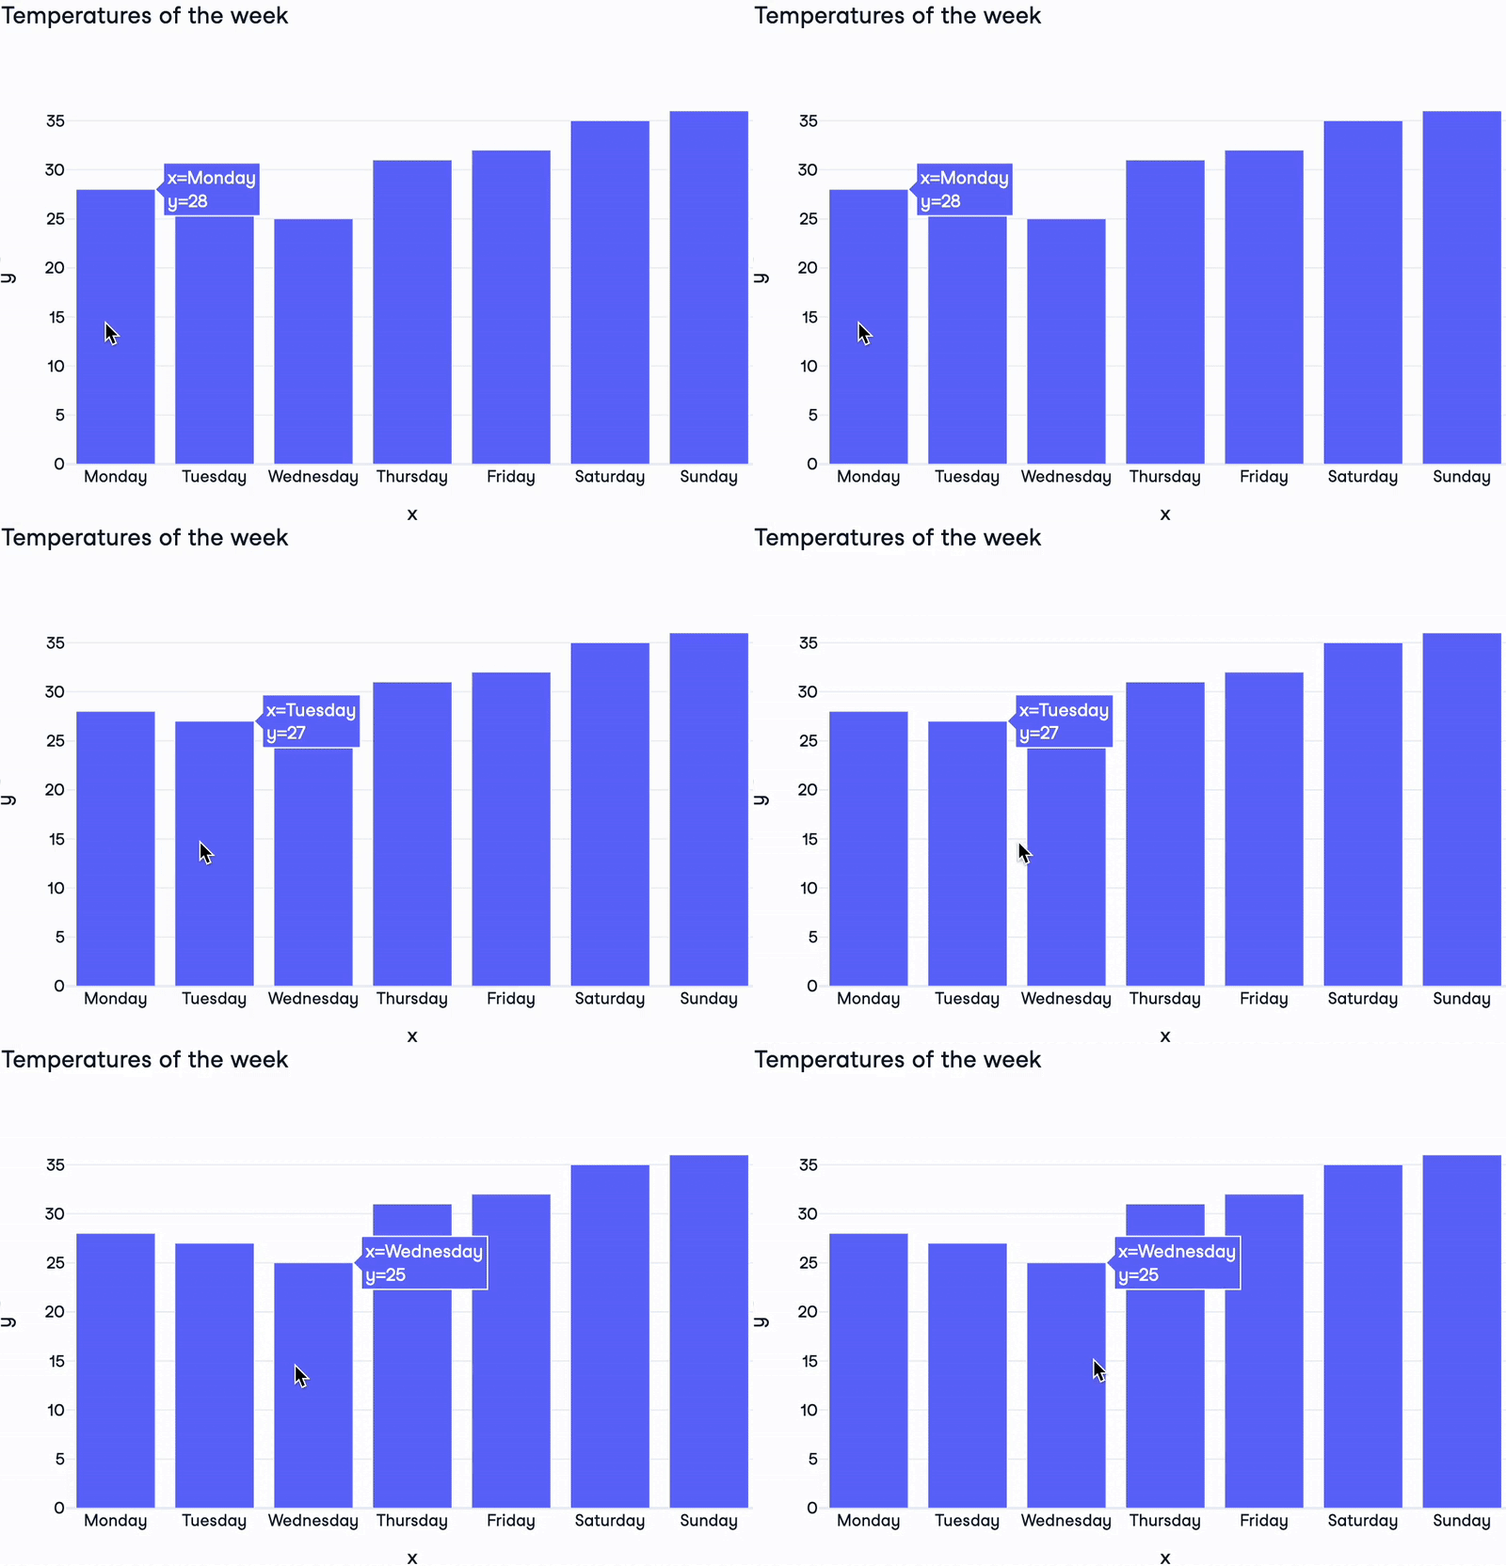
import plotly.express as pxdays = ["Monday", "Tuesday", "Wednesday", "Thursday", "Friday", "Saturday", "Sunday"] temperatures = [28, 27, 25, 31, 32, 35, 36]fig = px.bar( x=days, y=temperatures, title="Temperatures of the week")fig.show()

องค์ประกอบของ Plotly Figure:
layout: Dictionary ที่ควบคุมรูปแบบของ figurelayout ได้หนึ่งอันต่อ figuredata: List ของ dictionary ที่กำหนดประเภทกราฟและข้อมูลtrace มีมากกว่า 40 ประเภท!frames: สำหรับพล็อตแบบแอนิเมชัน (นอกเหนือขอบเขตคอร์สนี้)
print(fig)
Figure({'data': [{'type': 'bar',
'x': array(['Monday', 'Tuesday', 'Wednesday', 'Thursday', 'Friday'
, 'Saturday','Sunday'], dtype=object),
'y': {'bdata': 'HBsZHyAjJA==....'}],
'layout': {'title': {'text': 'Temperatures of the week'}}})
$$

การแสดงผลข้อมูลด้วย Plotly ใน Python