Subplots

การแสดงผลข้อมูลด้วย Plotly ใน Python

Alex Scriven

Data Scientist

Subplots คืออะไร?
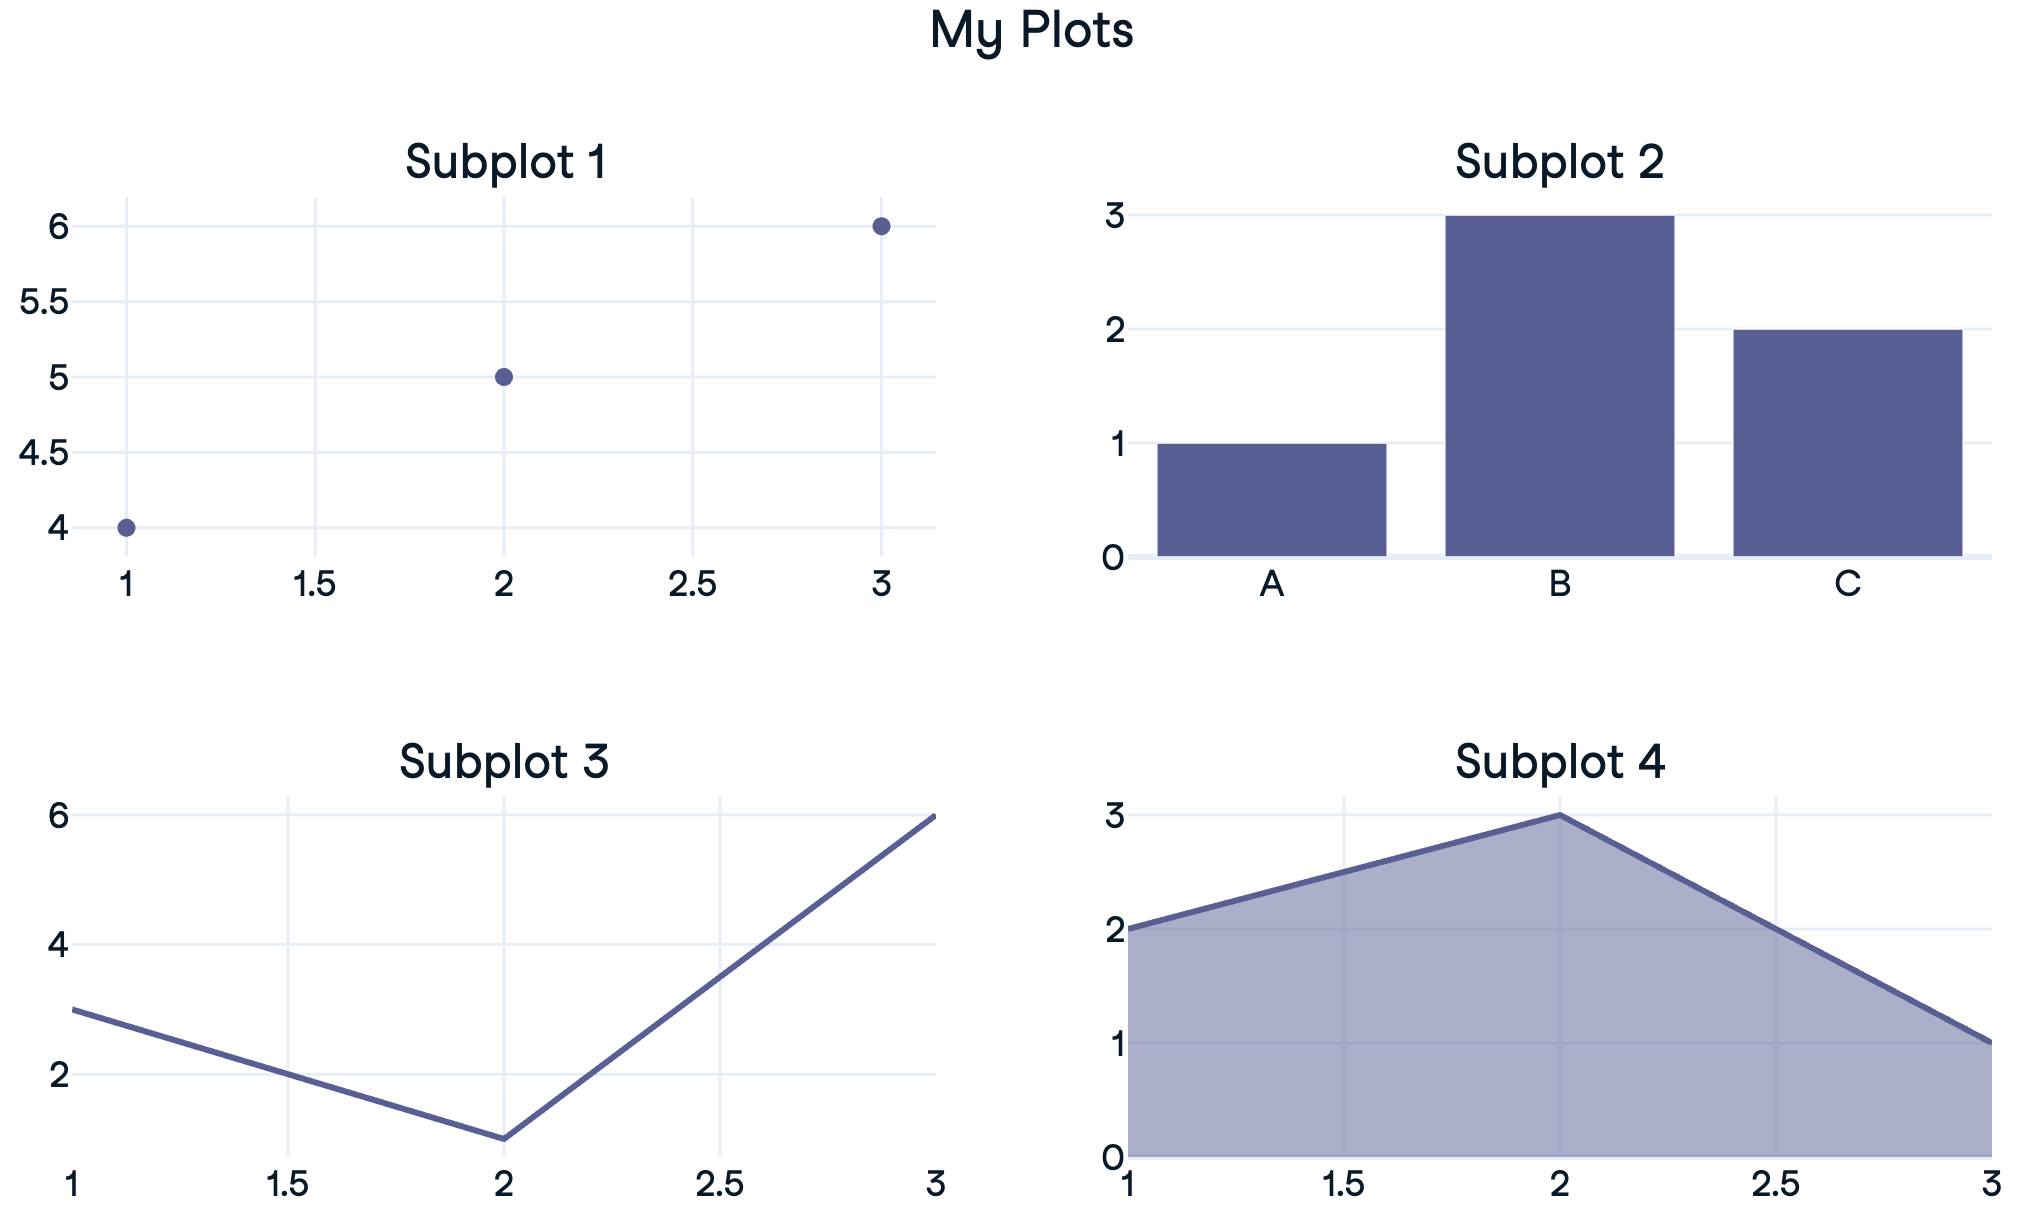
 

  • Subplots: 'mini-plots' ที่จัดเรียงในรูปแบบกริด

$$

  • แสดงกราฟหลายประเภท (ข้อมูลเดียวกัน) หรือข้อมูลต่างชุดกัน


โครงร่าง Subplots

การแสดงผลข้อมูลด้วย Plotly ใน Python

ทบทวน traces


  • ฟิกเกอร์ใน Plotly ประกอบด้วยรายการ traces — ข้อมูลและประเภทกราฟ

  • เข้าถึงได้ด้วย fig.data[0], fig.data[1]

    • เพิ่มเข้า subplots ได้ด้วย .add_trace()

$$

px_fig = px.scatter(df...)
print(px_fig)
Figure({'data': [trace1], 'layout': {...}})
การแสดงผลข้อมูลด้วย Plotly ใน Python

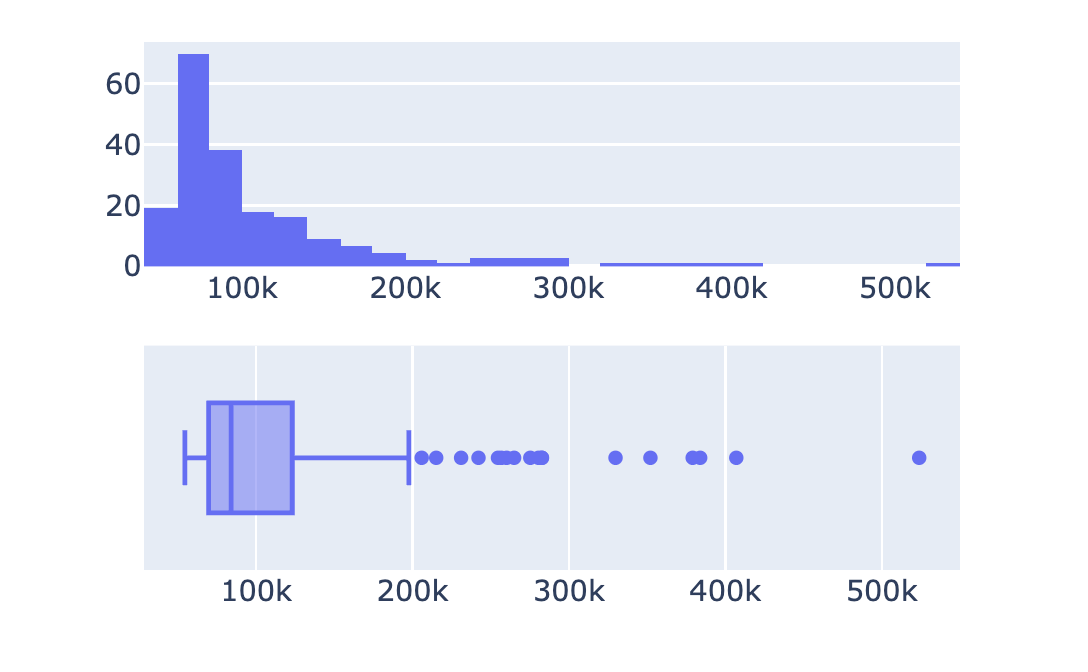
สร้าง subplot แบบ 1x2

import plotly.express as px
from plotly.subplots import make_subplots

# Create a subplot grid
fig = make_subplots(rows=2, cols=1)

# Create plotly express figures hist = px.histogram(revenues, x='Revenue') box = px.box(revenues, x='Revenue')
# Extract traces and add to subplots fig.add_trace(hist.data[0], row=1, col=1) fig.add_trace(box.data[0], row=2, col=1) fig.show()


Subplot ด้านการเงิน

การแสดงผลข้อมูลด้วย Plotly ใน Python

ปรับแต่ง subplots


  • ยังไม่มีชื่อกราฟหลัก
  • ยังไม่มีชื่อ subplot

$$

$$

$$

  • ✨ ปรับให้พร้อมนำเสนอ


Subplot การเงินแบบเรียบง่าย

การแสดงผลข้อมูลด้วย Plotly ใน Python

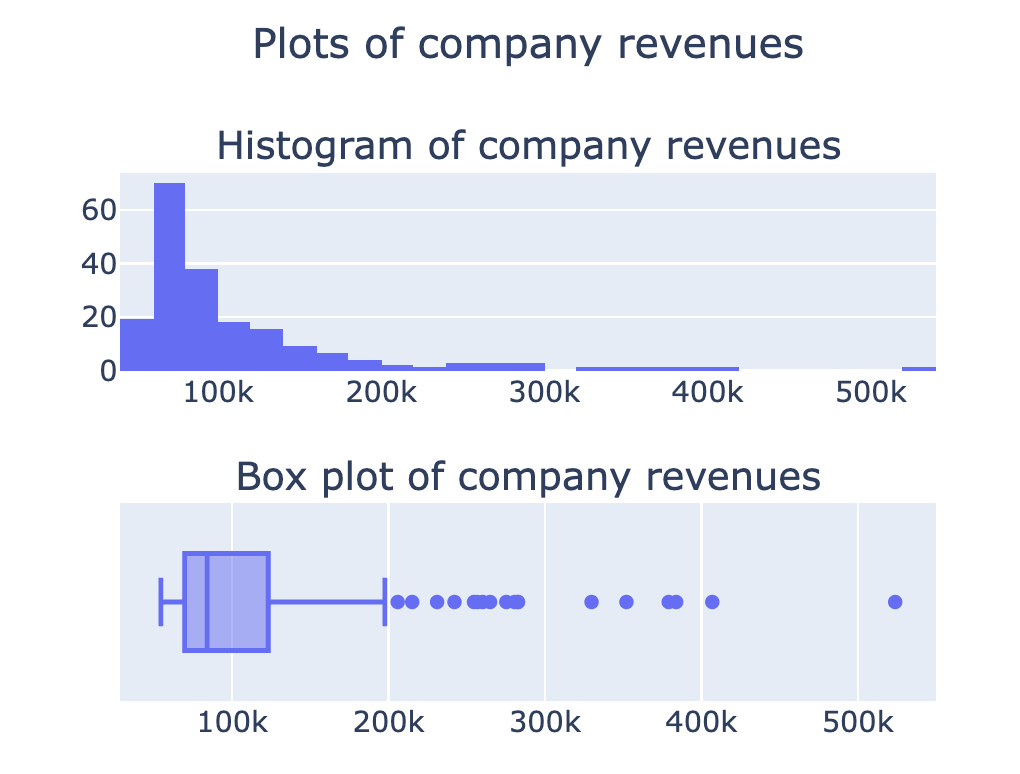
ชื่อ subplot

from plotly.subplots import make_subplots

fig = make_subplots(rows=2, cols=1,
    subplot_titles=[
    'Histogram of company revenues', 
    'Box plot of company revenues'])

## Add in traces (fig.add_trace())
fig.update_layout({'title': {'text': 'Plots of company revenues', 'x': 0.5, 'y': 0.9}}) fig.show()

แก้ไขชื่อ subplot แล้ว

ดูตัวเลือกเพิ่มเติมได้ใน เอกสารประกอบ

การแสดงผลข้อมูลด้วย Plotly ใน Python

Subplots แบบซ้อน

$$

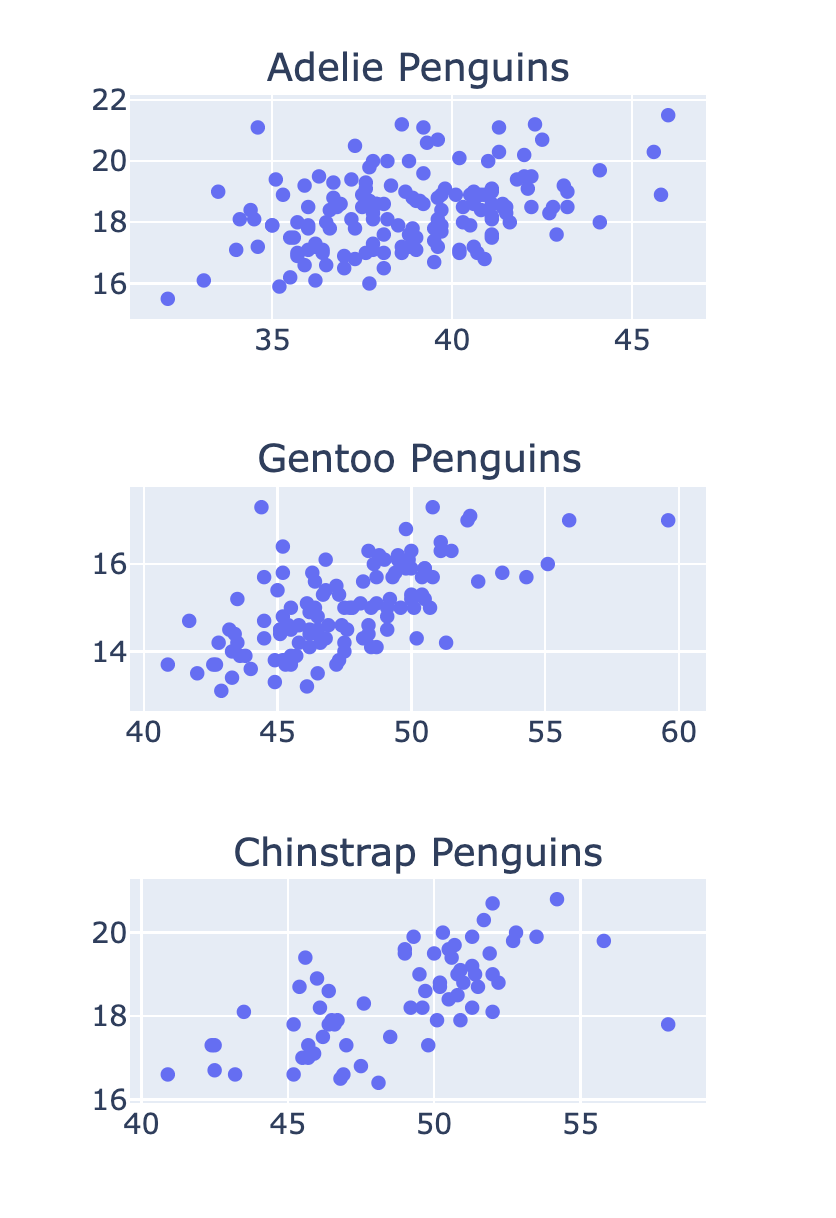
fig = make_subplots(rows=3, cols=1, 
  subplot_titles=['Adelie Penguins'
  , 'Gentoo Penguins', 'Chinstrap Penguins'])

row_num = 1 for species in ['Adelie', 'Gentoo', 'Chinstrap']: # Filter data for this species df = penguins[penguins['Species'] == species]
scatter = px.scatter(df, x='Culmen Length (mm)' , y='Culmen Depth (mm)') # Add the trace to the subplot fig.add_trace(scatter.data[0] , row=row_num, col=1) row_num +=1

Subplots เพนกวินแบบซ้อน

การแสดงผลข้อมูลด้วย Plotly ใน Python

Subplots แบบใช้แกนร่วมกัน


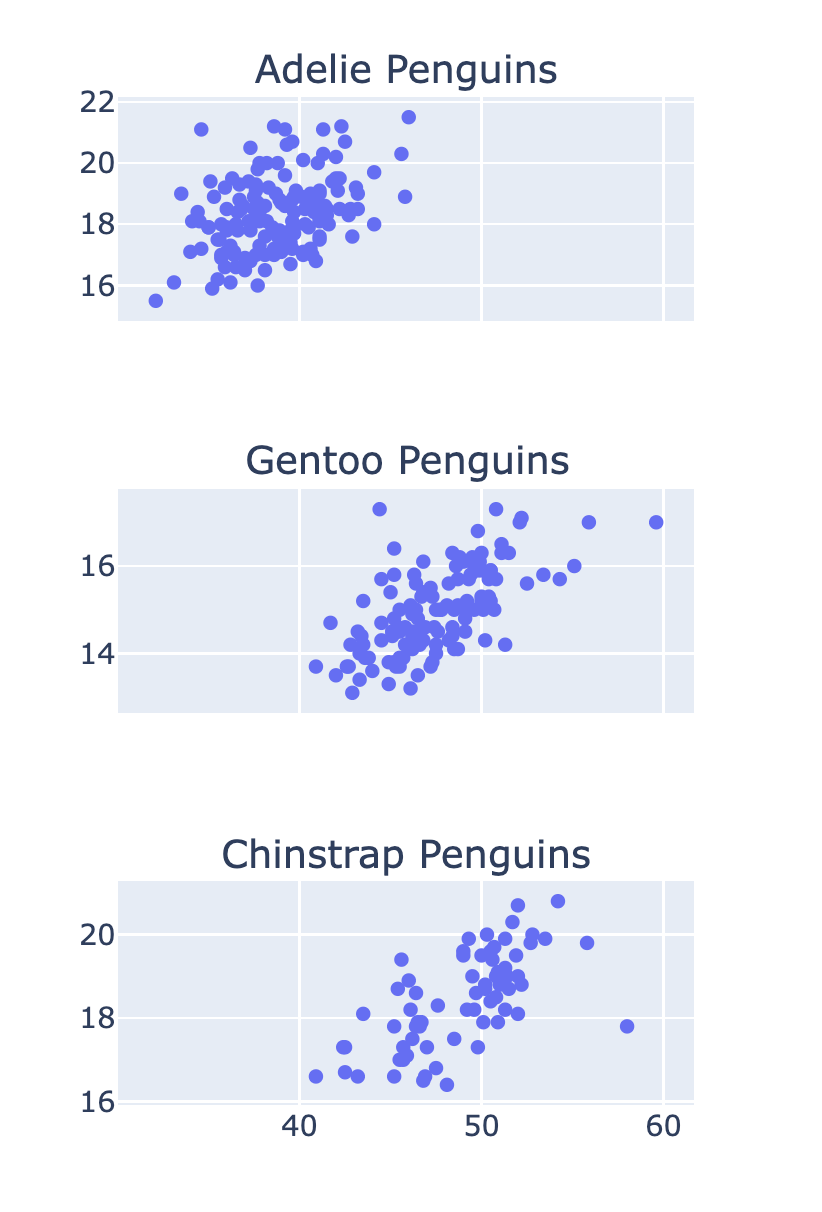
  • การใช้แกน x ร่วมกัน:
fig = make_subplots(
    rows=3, cols=1
    , shared_xaxes=True)

Subplots เพนกวินที่ใช้แกน x ร่วมกัน

การแสดงผลข้อมูลด้วย Plotly ใน Python

มาฝึกกันเถอะ!

การแสดงผลข้อมูลด้วย Plotly ใน Python

Preparing Video For Download...