การแสดงผลข้อมูลด้วย Plotly ใน Python
Alex Scriven
Data Scientist
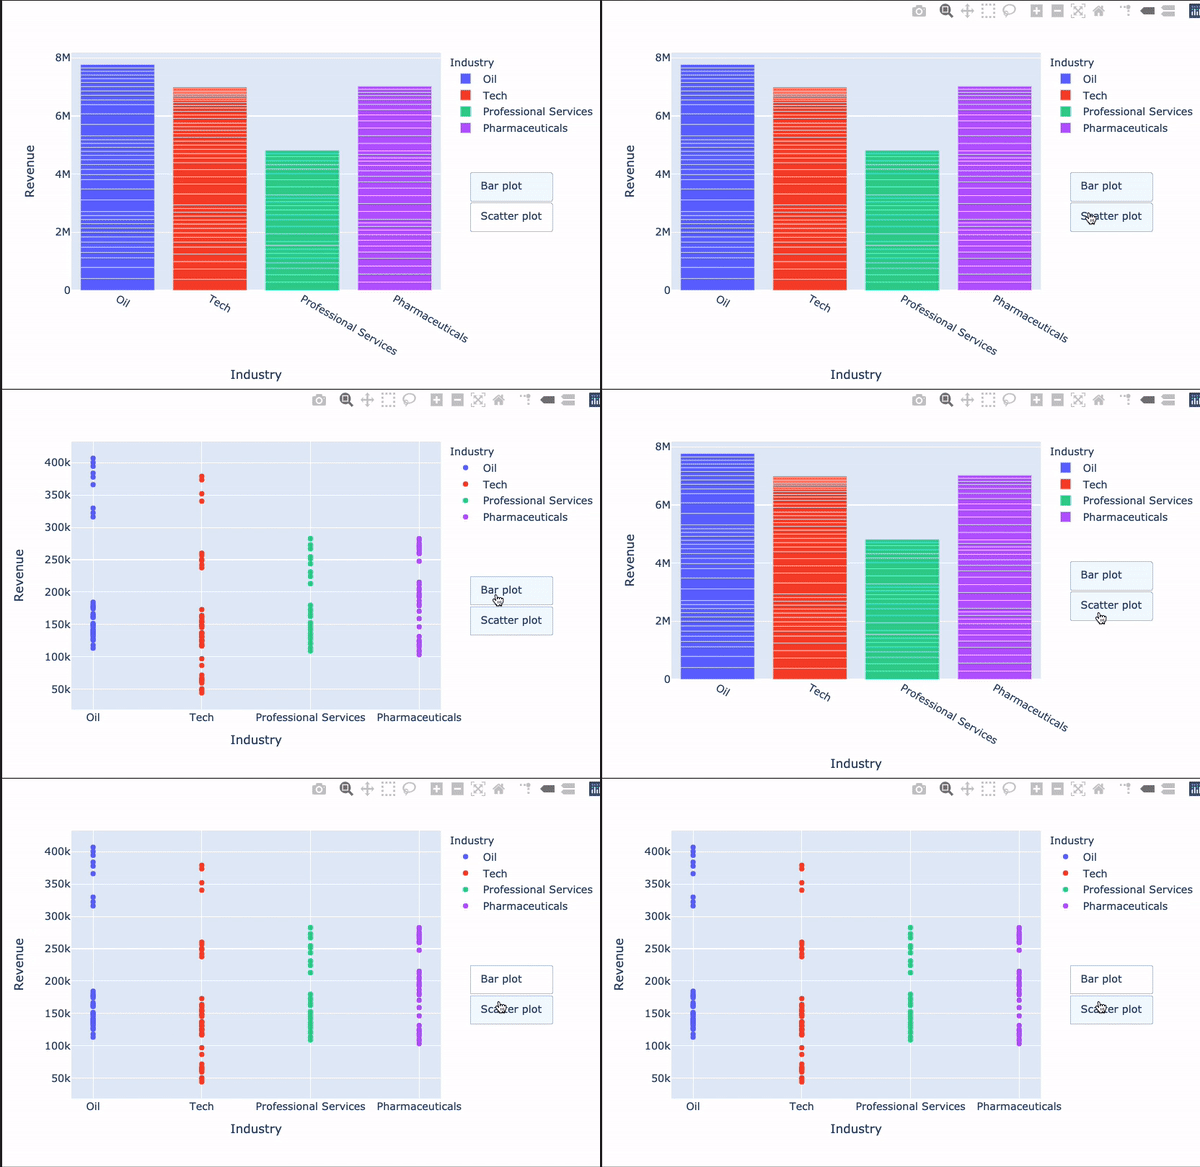
ปุ่มแบบกำหนดเองทำได้:
อัปเดตข้อมูลหรือองค์ประกอบ layout ของกราฟ
update_layout() สามารถใส่ไว้ในปุ่มได้!ช่วยในการสร้างแอนิเมชัน (นอกเหนือขอบเขตของคอร์สนี้)
เพิ่มผ่านอาร์กิวเมนต์ updatemenus พร้อมพารามิเตอร์:
type: buttons หรือ dropdowndirection: ทิศทางของปุ่มleft) หรือซ้อนกัน (down)x/y: ค่าทศนิยมสำหรับกำหนดตำแหน่งปุ่มshowactive: True/False เพื่อแสดงปุ่ม active (ดัชนีของปุ่ม) ว่าถูกกดหรือไม่buttons: รายการของออบเจกต์ button$$
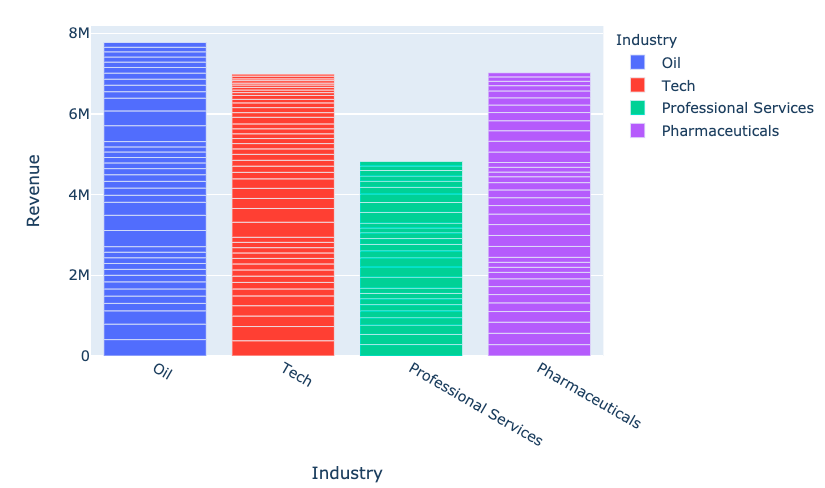
fig = px.bar(
data_frame=revenues,
x='Industry', y='Revenue',
color='Industry')
fig.show()

my_buttons = [{'label': "Bar plot",'method': "update",'args': [{"type": "bar"}]},{'label': "scatterplot",'method': "update",'args': [{"type": "scatter", 'mode': 'markers'}]}]
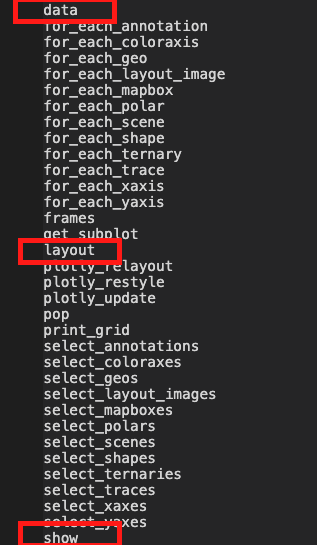
หนึ่งในส่วนที่สับสนที่สุดของ Plotly!
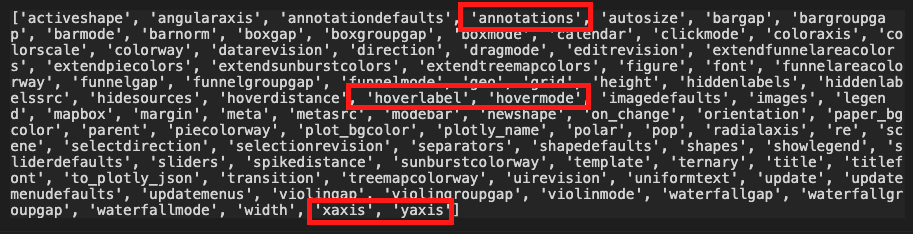
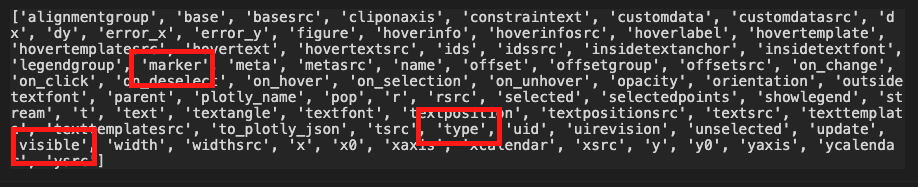
[{dictionary to send to data}, {dictionary to send to layout}]

dir(fig.layout)

'args'dir(fig.data[0])

$$
fig.update_layout({ 'updatemenus': [{'type': "buttons",'direction': 'down', 'x': 1.3, 'y': 0.5,'showactive': True, 'active': 0,'buttons': my_buttons}] }) fig.show()
$$

การแสดงผลข้อมูลด้วย Plotly ใน Python