การวิเคราะห์พลังงานสถิติ: ขนาดตัวอย่างและขนาดเอฟเฟกต์

การออกแบบการทดลองด้วย Python

James Chapman

Curriculum Manager, DataCamp

พื้นฐานของขนาดเอฟเฟกต์
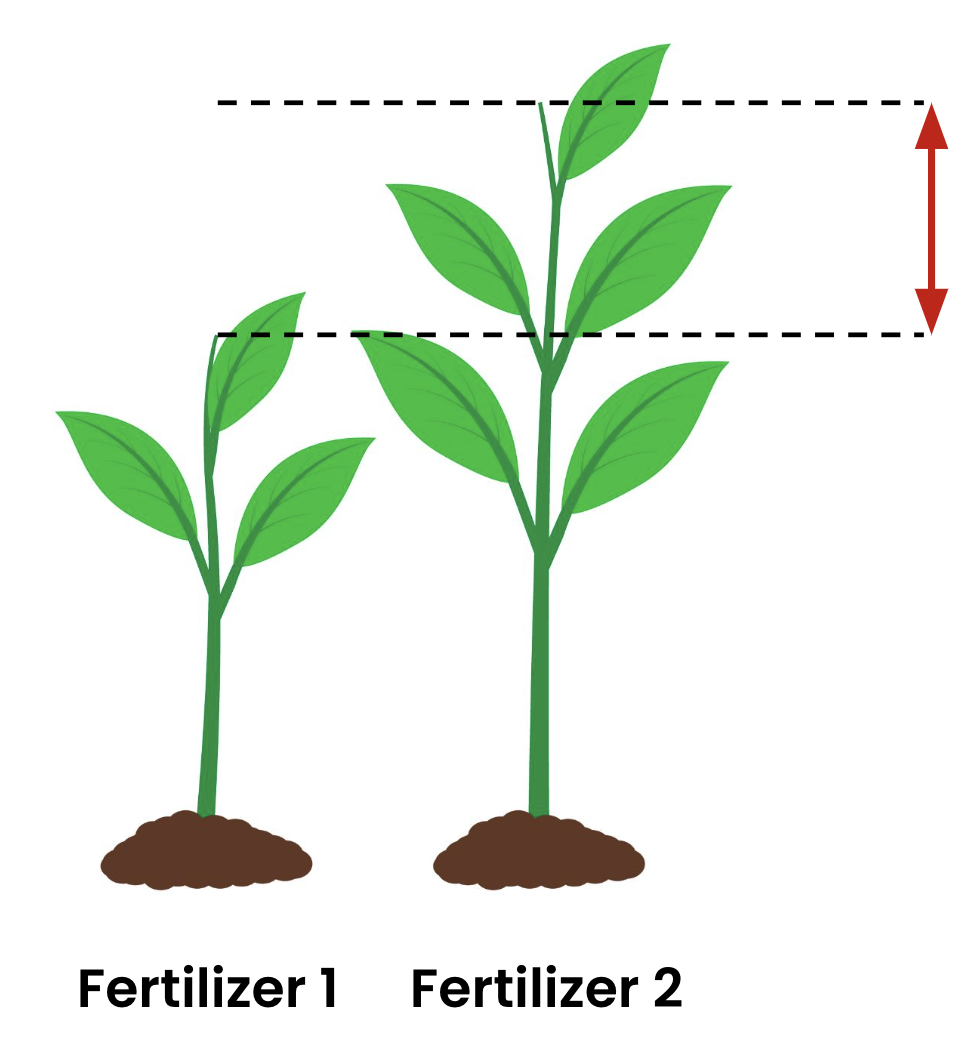
 

  • ขนาดเอฟเฟกต์: วัดความแตกต่างระหว่างสองกลุ่ม


  • Cohen's d: ตัววัดขนาดเอฟเฟกต์มาตรฐาน

ต้นไม้สองต้นที่ได้รับปุ๋ยต่างชนิดกันและเติบโตสูงต่างกัน มีลูกศรชี้แสดงความต่างของความสูงเพื่อแทนขนาดเอฟเฟกต์

การออกแบบการทดลองด้วย Python

ชุดข้อมูล: การมีส่วนร่วมกับวิดีโอเกม

  • ผู้เข้าร่วม 60 คน
    • 30 คนถูกสุ่มมอบหมายให้เล่น Action
    • 30 คนถูกสุ่มมอบหมายให้เล่น Puzzle
video_game_data.head()
   Game_Genre  Engagement_Time
0      Action              5.1
1      Puzzle              4.4
2      Action              7.2
3      Action              5.3
4      Puzzle              2.7
การออกแบบการทดลองด้วย Python

ภาพรวมการคำนวณพลังงานสถิติ

  • พลังงานสถิติ: ความน่าจะเป็นที่จะปฏิเสธสมมติฐานหลักเท็จได้อย่างถูกต้อง: ($1 - \beta$)

    • มีค่าระหว่าง 0 ถึง 1 (ความแน่นอนในการตรวจจับเอฟเฟกต์จริง)
  • สมมติ effect_size=1 จากข้อมูลในอดีต

from statsmodels.stats.power import TTestIndPower
power_analysis = TTestIndPower()

power = power_analysis.solve_power(effect_size=1, nobs1=30, alpha=0.05) print(power)
0.9677082519951168
การออกแบบการทดลองด้วย Python

สูตรคำนวณ Cohen's d

def cohens_d(group1, group2):

diff = group1.mean() - group2.mean() n1, n2 = len(group1), len(group2) var1, var2 = group1.var(), group2.var()
pooled_std = np.sqrt(((n1 - 1) * var1 + (n2 - 1) * var2) / (n1 + n2 - 2))
d = diff / pooled_std return d

ส่วนเบี่ยงเบนมาตรฐานแบบรวม: $\sigma_{p} = \sqrt{\frac{(n_1 - 1) \times \text{var}_1 + (n_2 - 1) \times \text{var}_2}{n_1 + n_2 - 2}}$

การออกแบบการทดลองด้วย Python

Cohen's d สำหรับข้อมูลวิดีโอเกม

action_times = video_game_data[video_game_data['Game_Genre'] == 'Action']['Engagement_Time']
puzzle_times = video_game_data[video_game_data['Game_Genre'] == 'Puzzle']['Engagement_Time']

d = cohens_d(action_times, puzzle_times) print(f"Cohen's d: {d}")
Cohen's d: 1.161524633221452
การออกแบบการทดลองด้วย Python

ทำความเข้าใจขนาดตัวอย่างและพลังงานสถิติ

  • ความสมดุล ระหว่างพลังงานสถิติและขนาดตัวอย่าง
  • ขนาดตัวอย่างที่ใหญ่ขึ้นช่วยเพิ่มพลังงานสถิติ
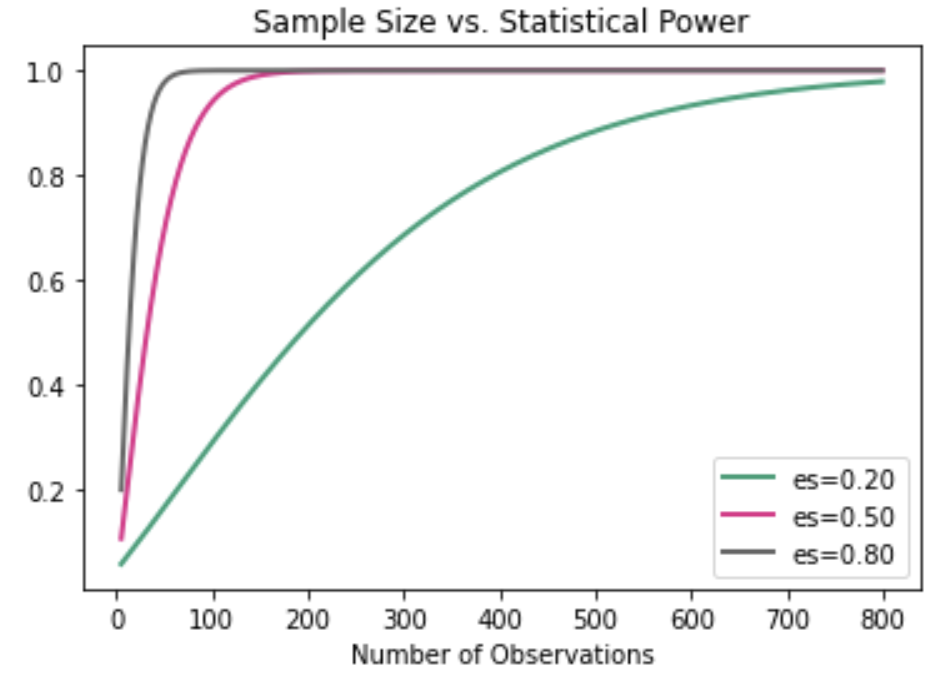
ขนาดตัวอย่างเทียบกับพลังงานสถิติ

1 https://grabngoinfo.com/power-analysis-for-sample-size-using-python/
การออกแบบการทดลองด้วย Python

การคำนวณขนาดตัวอย่างในบริบทจริง

  • ตัวแปรตอบสนอง: engagement_time
from statsmodels.stats.power import TTestIndPower
power_analysis = TTestIndPower()
required_n = power_analysis.solve_power(effect_size=d, alpha=0.05, 
                                        power=0.99, ratio=1)
print(required_n)
28.237827708942007
การออกแบบการทดลองด้วย Python

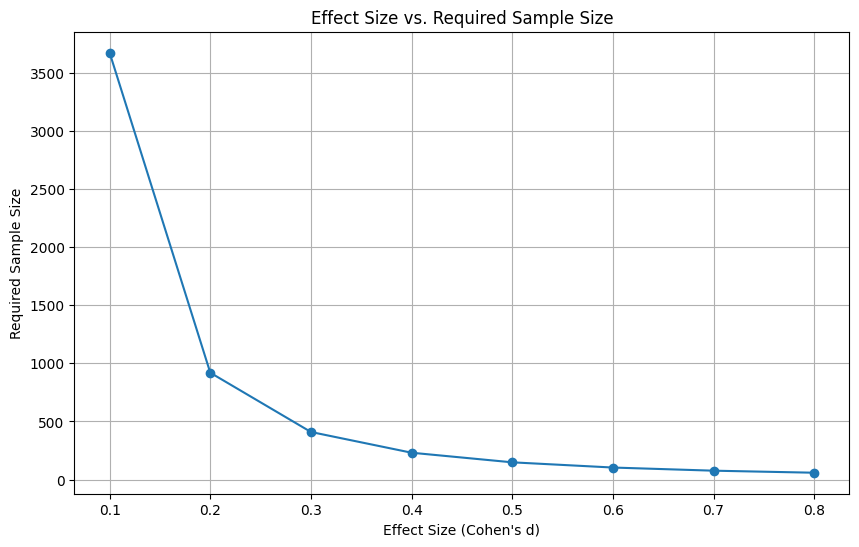
แสดงผลขนาดตัวอย่างที่ต้องการด้วยกราฟ

import numpy as np
import matplotlib.pyplot as plt
effect_sizes = np.linspace(0.1, 0.8, 8)
sample_sizes = [power_analysis.solve_power(effect_size=es, alpha=0.05, power=0.99, 
                                           ratio=1) for es in effect_sizes]

plt.figure(figsize=(10, 6))
plt.plot(effect_sizes, sample_sizes, 'o-')
plt.title('Effect Size vs. Required Sample Size')
plt.xlabel('Effect Size (Cohen\'s d)')
plt.ylabel('Required Sample Size')
plt.grid(True)
plt.show()
การออกแบบการทดลองด้วย Python

แสดงผลขนาดตัวอย่างที่ต้องการด้วยกราฟ

ขนาดเอฟเฟกต์เทียบกับขนาดตัวอย่างที่ต้องการ

การออกแบบการทดลองด้วย Python

มาฝึกกันเถอะ!

การออกแบบการทดลองด้วย Python

Preparing Video For Download...