Local explainability ด้วย LIME

Explainable AI ด้วย Python

Fouad Trad

Machine Learning Engineer

  • LIMELocal Interpretable Model-Agnostic Explanations
  • อธิบายการทำนายของโมเดลที่ซับซ้อน
  • ทำงานกับข้อมูลแต่ละอินสแตนซ์
  • ใช้ได้กับโมเดลทุกประเภท

โลโก้ LIME

Explainable AI ด้วย Python

LIME explainers

  • ปรับให้เหมาะกับข้อมูลแต่ละประเภท

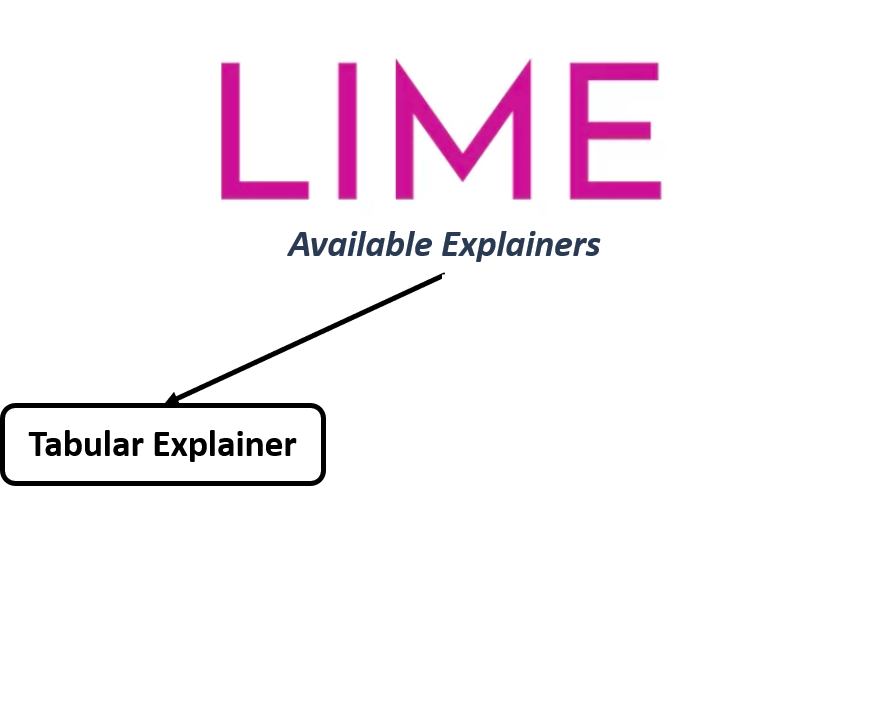
ไดอะแกรมแสดง LIME explainer ที่มีอยู่ อันแรกคือ LIME tabular explainer

Explainable AI ด้วย Python

LIME explainers

  • ปรับให้เหมาะกับข้อมูลแต่ละประเภท

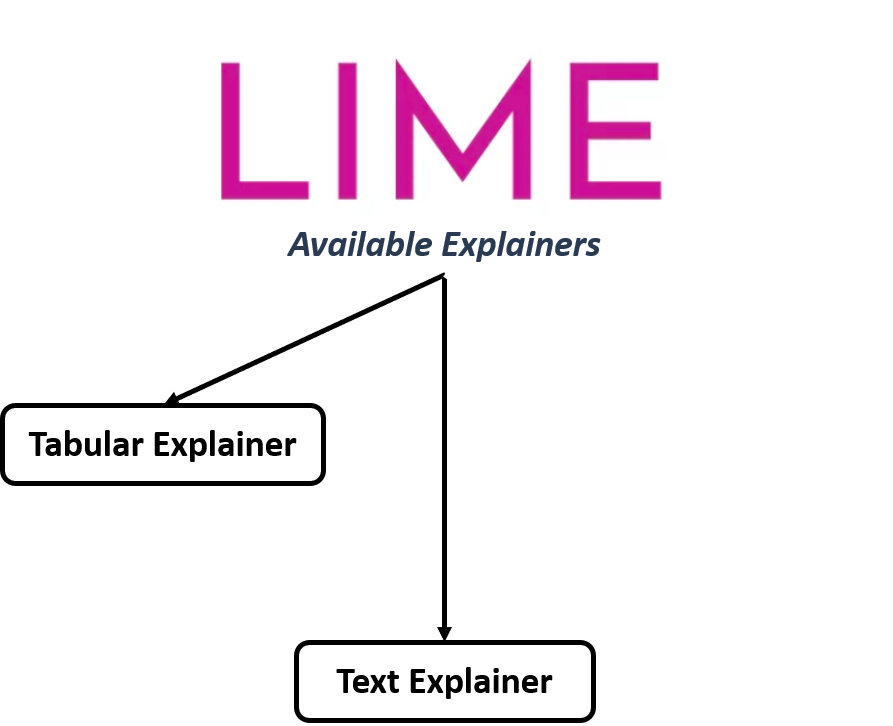
ไดอะแกรมเดิมที่แสดง Text Explainer เพิ่มเติม

Explainable AI ด้วย Python

LIME explainers

  • ปรับให้เหมาะกับข้อมูลแต่ละประเภท
  • สร้าง perturbation รอบตัวอย่างข้อมูล
  • ดูผลกระทบต่อ output ของโมเดล
  • สร้างโมเดลที่เรียบง่ายกว่าเพื่ออธิบาย

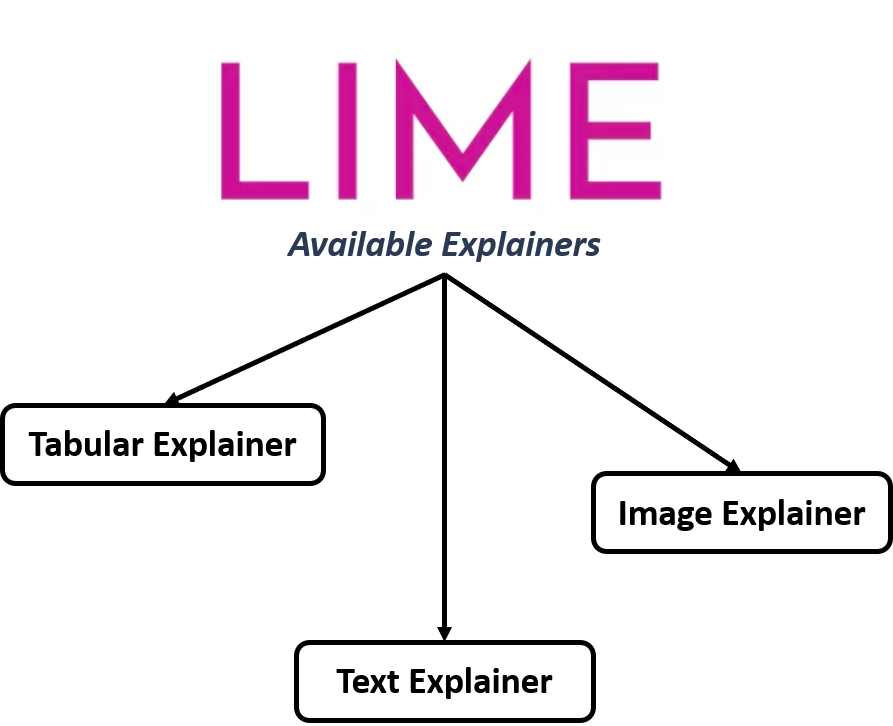
ไดอะแกรมเดิมที่แสดง Image Explainer เพิ่มเติม

Explainable AI ด้วย Python

LIME explainers

  • ปรับให้เหมาะกับข้อมูลแต่ละประเภท
  • สร้าง perturbation รอบตัวอย่างข้อมูล
  • ดูผลกระทบต่อ output ของโมเดล
  • สร้างโมเดลที่เรียบง่ายกว่าเพื่ออธิบาย

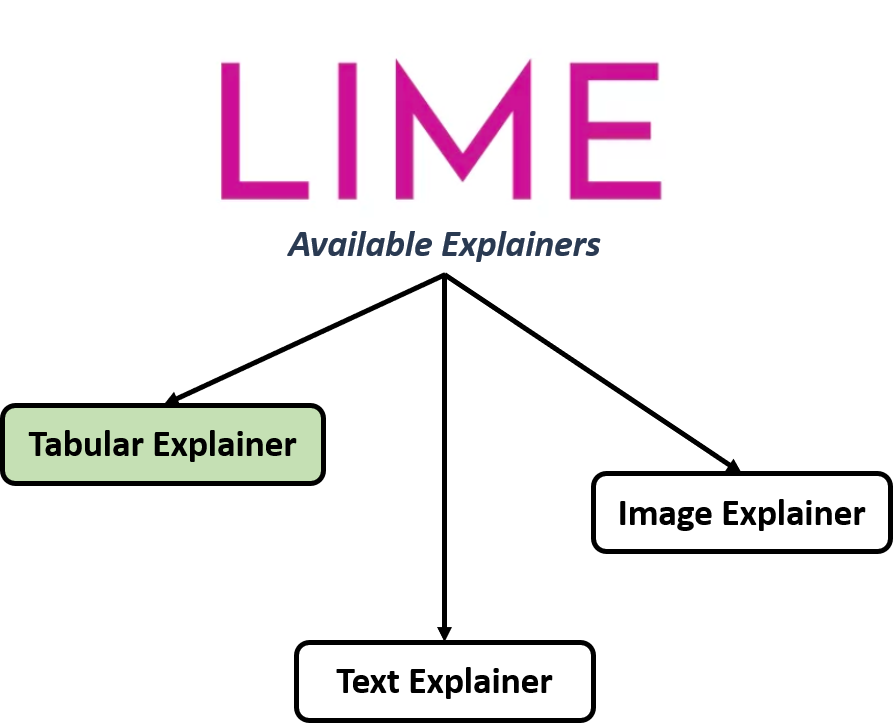
ไดอะแกรมเดิมที่ไฮไลต์ Tabular explainer

Explainable AI ด้วย Python

ชุดข้อมูลการสมัครเข้าศึกษา

GRE Score TOEFL Score University Rating SOP LOR CGPA Chance of Admit Accept
337 118 4 4.5 4.5 9.65 0.92 1
324 107 4 4 4.5 8.87 0.76 1
316 104 3 3 3.5 8 0.72 1
322 110 3 3.5 2.5 8.67 0.8 1
314 103 2 2 3 8.21 0.45 0


  • regressor: ทำนายโอกาสในการรับเข้า
  • classifier: ทำนายผลการรับเข้า
  • ฟีเจอร์ใน X
Explainable AI ด้วย Python

สร้าง tabular explainer

Regression
from lime.lime_tabular import LimeTabularExplainer

instance = X.iloc[1,:]
explainer_reg = LimeTabularExplainer( X.values,
feature_names=X.columns,
mode='regression'
)
explanation_reg = explainer_reg.explain_instance(
instance.values,
regressor.predict
)
Classification
from lime.lime_tabular import LimeTabularExplainer

instance = X.iloc[1,:]
explainer_class = LimeTabularExplainer( X.values,
feature_names=X.columns,
mode='classification'
)
explanation_class = explainer_class.explain_instance(
instance.values,
classifier.predict_proba
)
Explainable AI ด้วย Python

แสดงผลการอธิบาย

Regression
explanation_reg.as_pyplot_figure()
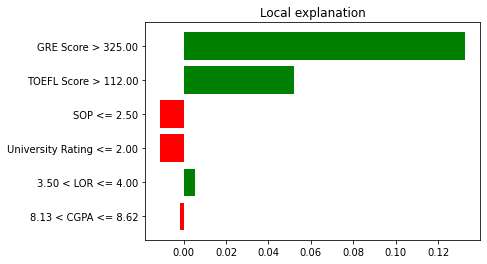
กราฟแท่งแสดงผลกระทบของแต่ละฟีเจอร์ต่อโมเดล regression โดยฟีเจอร์แสดงในช่วงค่าเพื่อความสามารถในการตีความที่ดีขึ้น

Classification
explanation_class.as_pyplot_figure()
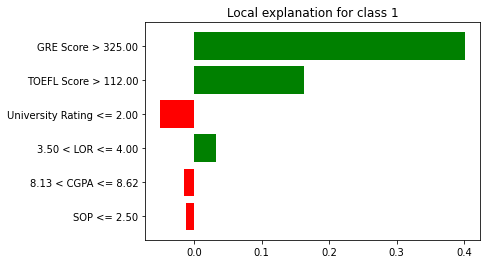
กราฟแท่งแสดงผลกระทบของแต่ละฟีเจอร์ต่อโมเดล classification โดยฟีเจอร์แสดงในช่วงค่าเพื่อความสามารถในการตีความที่ดีขึ้น

Explainable AI ด้วย Python

SHAP vs. LIME

SHAP
shap.waterfall_plot(...)
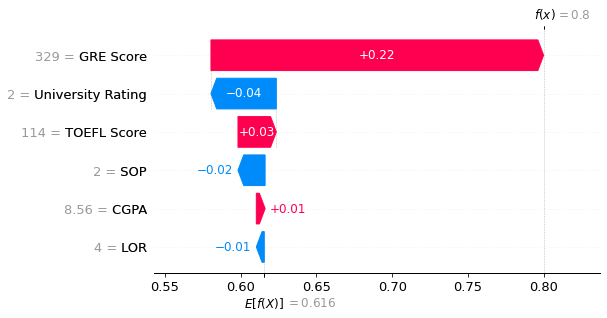
กราฟ waterfall ของ SHAP แสดงว่าแต่ละฟีเจอร์ส่งผลต่อการทำนายในทิศทางบวกหรือลบ

LIME
explanation_class.as_pyplot_figure()

กราฟแท่งแสดงผลกระทบของแต่ละฟีเจอร์ต่อโมเดล classification โดยฟีเจอร์แสดงในช่วงค่าเพื่อความสามารถในการตีความที่ดีขึ้น

Explainable AI ด้วย Python

มาฝึกกันเถอะ!

Explainable AI ด้วย Python

Preparing Video For Download...