Forecasting Product Demand in R
Aric LaBarr, Ph.D.
Senior Data Scientist, Elder Research
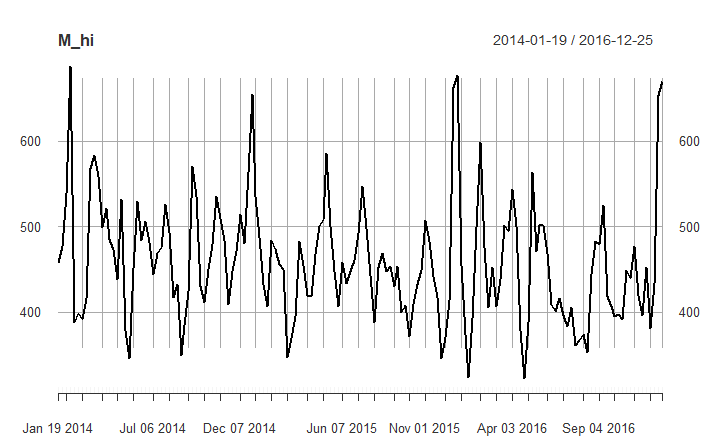
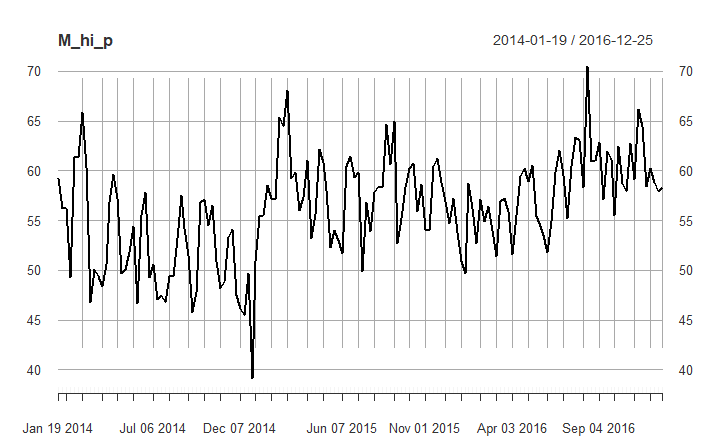
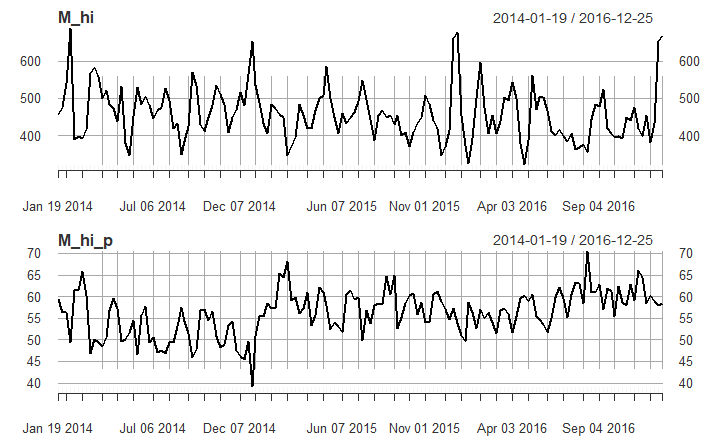
plot(M_hi)
plot(M_hi_p)
v.dates <- as.Date(c("2014-02-09", "2015-02-08", "2016-02-07")) valentine <- as.xts(rep(1, 3), order.by = v.dates)
dates_train <- seq(as.Date("2014-01-19"), length = 154, by = "weeks") valentine <- merge(valentine, dates_train, fill = 0)
head(valentine, n = 5)
valentine
2014-01-19 0
2014-01-26 0
2014-02-02 0
2014-02-09 1
2014-02-16 0
M_hi_train <- data.frame(M_hi_train, as.vector(valentine)) model_M_hi_full <- lm(log_sales ~ log_price + valentine, data = M_hi_train)
summary(model_M_hi_full)
Coefficients:
Estimate Std. Error t value Pr(>|t|)
(Intercept) 8.93102 0.44693 19.983 < 2e-16 ***
log_price -0.70010 0.11103 -6.306 3e-09 ***
valentine 0.22942 0.07547 3.040 0.00279 **
Signif. codes: 0 *** 0.001 ** 0.01 * 0.05 . 0.1 1
Forecasting Product Demand in R