Top-Down Hierarchical Forecasting
Forecasting Product Demand in R

Aric LaBarr, Ph.D.
Senior Data Scientist, Elder Research
Top-down Forecasting
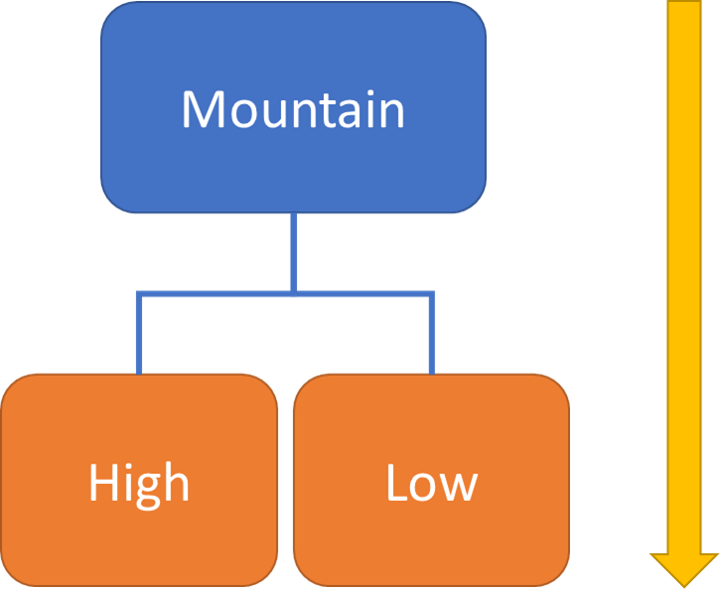
Top-down Reconciliation
- Two Techniques
- Average of historical proportions
- Proportion of historical averages
- Reconciled forecasts at lower level not as accurate as directly forecasting
Forecast Regional Total Sales
M_total <- M_hi + M_loM_t_model_arima <- auto.arima(M_total) summary(M_t_model_arima)
Series: M_total
ARIMA(4,0,1) with non-zero mean

Coefficients:
         ar1      ar2     ar3     ar4      ma1       mean
      1.3158  -0.5841  0.1546  0.0290  -0.6285  2037.5977
s.e.  0.3199   0.2562  0.1534  0.1165   0.3089    87.5028

sigma^2 estimated as 67471:  log likelihood=-1072.02
AIC=2158.05   AICc=2158.81   BIC=2179.31
Forecast Regional Total Sales
for_M_t <- forecast(M_t_model_arima, h = 22) dates_valid <- seq(as.Date("2017-01-01"), length = 22, by = "weeks") for_M_t_xts <- xts(for_M_t$mean, order.by = dates_valid)M_t_v <- bev_xts_valid[,"M.hi"] + bev_xts_valid[,"M.lo"] MAPE <- 100*mean(abs((for_M_t_xts - M_t_v)/M_t_v)) print(MAPE)
[1] 9.576247
Average of Historical Proportions
head(M_hi, n = 5)
           M.hi
2014-01-19  458
2014-01-26  477
2014-02-02  539
2014-02-09  687
2014-02-16  389
head(M_total, n = 5)
           M.t
2014-01-19 1913
2014-01-26 2233
2014-02-02 2835
2014-02-09 3927
2014-02-16 2641
Average of Historical Proportions
head(M_hi/M_total, n = 5)
                M.hi
2014-01-19 0.2394145
2014-01-26 0.2136140
2014-02-02 0.1901235
2014-02-09 0.1749427
2014-02-16 0.1472927
Average of Historical Proportions
prop_hi <- mean(M_hi/M_total)
print(prop_hi)
[1] 0.2317795
prop_lo <- mean(M_lo/M_total)
print(prop_lo)
[1] 0.7682205
Average of Historical Proportions
for_prop_hi <- prop_hi*for_M_t_xts for_prop_lo <- prop_lo*for_M_t_xtsMAPE_hi <- 100*mean(abs((for_prop_hi - M_hi_v)/M_hi_v)) MAPE_lo <- 100*mean(abs((for_prop_lo - M_lo_v)/M_lo_v))
print(MAPE_hi)
[1] 15.01613
print(MAPE_lo)
[1] 11.94092
Proportion of Historical Averages
prop_hi_2 <- mean(M_hi)/mean(M_total)
prop_lo_2 <- mean(M_lo)/mean(M_total)
print(prop_hi_2)
0.2275504
print(prop_lo_2)
0.7724496
Proportion of Historical Averages
for_prop_hi_2 <- prop_hi_2*for_M_t_xts for_prop_lo_2 <- prop_lo_2*for_M_t_xtsMAPE_hi <- 100*mean(abs((for_prop_hi_2 - M_hi_v)/M_hi_v)) MAPE_lo <- 100*mean(abs((for_prop_lo_2 - M_lo_v)/M_lo_v))
print(MAPE_hi)
[1] 14.31853
print(MAPE_lo)
[1] 12.01166
Let's practice!
Forecasting Product Demand in R

