Forecasting
Forecasting Product Demand in R

Aric LaBarr, Ph.D.
Senior Data Scientist, Elder Research
Forecasting
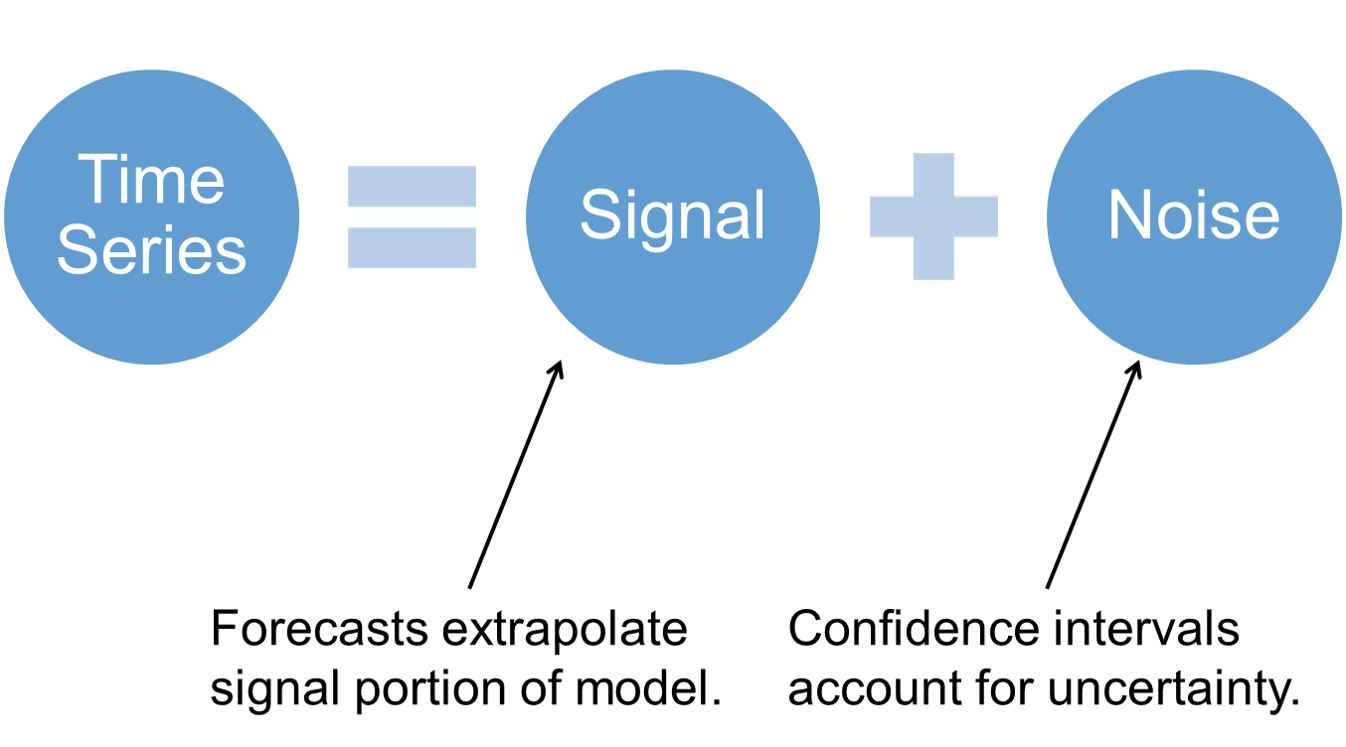
- Goal of most time series models!
- Models use past values or "shocks" to predict the future
- Pattern recognition followed by pattern repetition
Forecasting

Forecasting Example
forecast_M_t <- forecast(M_t_model, h = 22)for_dates <- seq(as.Date("2017-01-01"), length = 22, by = "weeks") for_M_t_xts <- xts(forecast_M_t$mean, order.by = for_dates)plot(M_t_valid, main = 'Forecast Comparison') lines(for_M_t_xts, col = "blue")

How to Evaluate Forecasts?
2 Common Measures of Accuracy:
Mean Absolute Error (MAE) $$ \frac {1}{n} \sum_{i=1}^n |Y_t - \hat{Y}_t| $$
Mean Absolute Percentage Error (MAPE) $$ \frac {1}{n} \sum_{i=1}^n | \frac {Y_t - \hat{Y}_t} {Y_t} | \times 100 $$
MAE and MAPE Example
for_M_t <- as.numeric(forecast_M_t$mean) v_M_t <- as.numeric(M_t_valid)MAE <- mean(abs(for_M_t - v_M_t)) MAPE <- 100*mean(abs((for_M_t - v_M_t)/v_M_t))print(MAE)
[1] 198.7976
print(MAPE)
[1] 9.576247
Let's practice!
Forecasting Product Demand in R

