MA สำหรับระบุแนวโน้ม

การเทรดทางการเงินด้วย Python

Chelsea Yang

Data Science Instructor

Technical indicator คืออะไร?

  • การคำนวณทางคณิตศาสตร์จากข้อมูลตลาดในอดีต
  • ถือว่าตลาดมีประสิทธิภาพและราคาสะท้อนข้อมูลสาธารณะทั้งหมดแล้ว
  • ช่วยให้เทรดเดอร์เข้าใจรูปแบบราคาในอดีต
การเทรดทางการเงินด้วย Python

ประเภทของ indicator

  • Trend indicators: วัดทิศทางหรือความแข็งแกร่งของแนวโน้ม
    • ตัวอย่าง: Moving averages (MA), Average Directional Movement Index (ADX)
  • Momentum indicators: วัดความเร็วของการเคลื่อนไหวของราคา
    • ตัวอย่าง: Relative Strength Index (RSI)
  • Volatility indicators: วัดขนาดของการเบี่ยงเบนของราคา
    • ตัวอย่าง: Bollinger Bands
การเทรดทางการเงินด้วย Python

แพ็กเกจ TA-Lib

TA-Lib : Technical Analysis Library

  • มี technical indicator ให้ใช้งานมากกว่า 150 รายการ
import talib
การเทรดทางการเงินด้วย Python

Moving average indicators

  • SMA: Simple Moving Average
  • EMA: Exponential Moving Average


  • ลักษณะเฉพาะ:
    • เคลื่อนไหวตามราคา
    • ปรับข้อมูลให้เรียบเพื่อแสดงทิศทางราคาได้ชัดขึ้น
การเทรดทางการเงินด้วย Python

Simple Moving Average (SMA)

$ SMA = (P_1+P_2+...+P_n)/n $

# Calculate two SMAs
stock_data['SMA_short'] = talib.SMA(stock_data['Close'], timeperiod=10)
stock_data['SMA_long'] = talib.SMA(stock_data['Close'], timeperiod=50)

# Print the last five rows print(stock_data.tail())
             Close  SMA_short  SMA_long
Date                                   
2020-11-24 1768.88    1758.77   1594.74
2020-11-25 1771.43    1760.65   1599.75
2020-11-27 1793.19    1764.98   1605.70
2020-11-30 1760.74    1763.35   1611.71
2020-12-01 1798.10    1765.02   1619.05

การเทรดทางการเงินด้วย Python

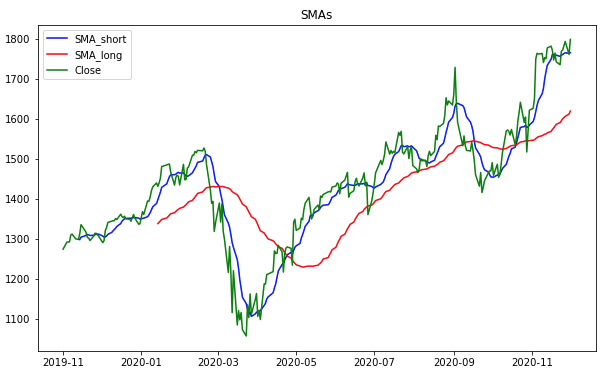
การพล็อต SMA

import matplotlib.pyplot as plt

# Plot SMA with the price
plt.plot(stock_data['SMA_short'], 
         label='SMA_short')
plt.plot(stock_data['SMA_long'], 
         label='SMA_long')
plt.plot(stock_data['Close'], 
         label='Close')

# Customize and show the plot
plt.legend()
plt.title('SMAs')
plt.show()

กราฟ SMA

การเทรดทางการเงินด้วย Python

Exponential Moving Average (EMA)

$EMA_n = P_n \times multiplier + \text{previous EMA} \times (1-multiplier)$

$multiplier = 2 / (n + 1)$

# Calculate two EMAs
stock_data['EMA_short'] = talib.EMA(stock_data['Close'], timeperiod=10)
stock_data['EMA_long'] = talib.EMA(stock_data['Close'], timeperiod=50)
# Print the last five rows
print(stock_data.tail())
             Close  EMA_short  EMA_long
Date                                   
2020-11-24 1768.88    1748.65   1640.98
2020-11-25 1771.43    1752.79   1646.09
2020-11-27 1793.19    1760.13   1651.86
2020-11-30 1760.74    1760.24   1656.13
2020-12-01 1798.10    1767.13   1661.70
การเทรดทางการเงินด้วย Python

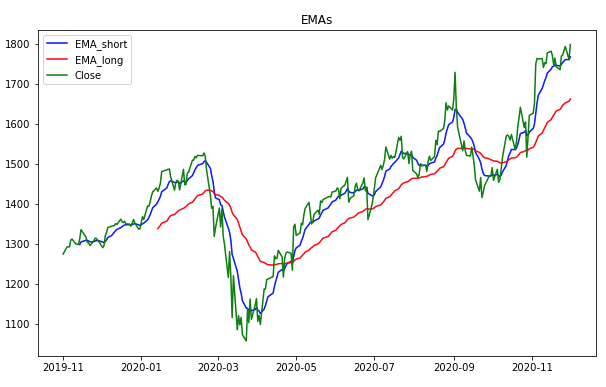
การพล็อต EMA

import matplotlib.pyplot as plt
# Plot EMA with the price
plt.plot(stock_data['EMA_short'], 
         label='EMA_short')
plt.plot(stock_data['EMA_long'], 
         label='EMA_long')
plt.plot(stock_data['Close'], 
         label='Close')

# Customize and show the plot
plt.legend()
plt.title('EMAs')
plt.show()

กราฟ EMA

การเทรดทางการเงินด้วย Python

SMA vs. EMA

EMA ไวต่อการเคลื่อนไหวของราคาล่าสุดมากกว่า
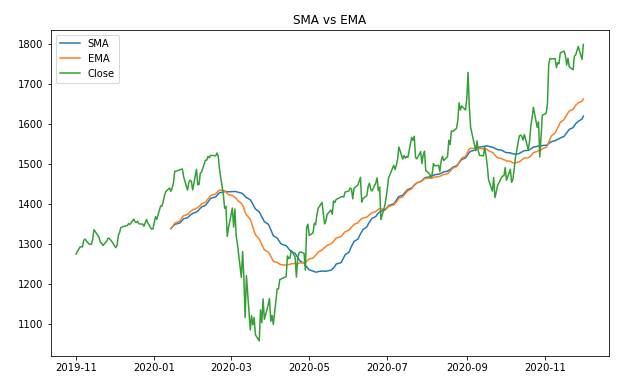
กราฟเปรียบเทียบ SMA กับ EMA ที่คำนวณด้วย lookback window เดียวกัน

การเทรดทางการเงินด้วย Python

มาฝึกกันเถอะ!

การเทรดทางการเงินด้วย Python

Preparing Video For Download...