ตัวบ่งชี้ความแข็งแกร่ง: ADX

การเทรดทางการเงินด้วย Python

Chelsea Yang

Data Science Instructor

ADX คืออะไร?

  • ย่อมาจาก "Average Directional Movement Index"
  • พัฒนาโดย J. Welles Wilder
    • "New Concepts in Technical Systems" (1987)
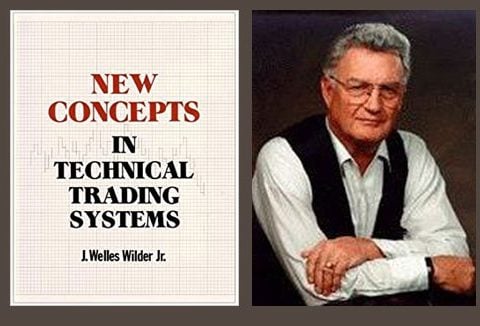
หนังสือของ Wells Wilder

  • วัดความแข็งแกร่งของแนวโน้ม
    • ค่าจะอยู่ระหว่าง 0 ถึง 100
    • ADX <= 25: ไม่มีแนวโน้ม
    • ADX > 25: ตลาดมีแนวโน้ม
    • ADX > 50: ตลาดมีแนวโน้มแข็งแกร่ง
การเทรดทางการเงินด้วย Python

ADX คำนวณอย่างไร?

  • คำนวณจากค่าเฉลี่ยที่ปรับแล้วของผลต่างระหว่าง +DI และ -DI
    • +DI (Plus Directional Index): วัดการมีอยู่ของแนวโน้มขาขึ้น
    • -DI (Minus Directional Index): วัดการมีอยู่ของแนวโน้มขาลง


  • ข้อมูลนำเข้าสำหรับการคำนวณ:
    • ราคาสูง ราคาต่ำ และราคาปิดของแต่ละช่วงเวลา
การเทรดทางการเงินด้วย Python

การใช้งาน ADX ใน Python

# Calculate ADX
stock_data['ADX'] = talib.ADX(stock_data['High'], stock_data['Low'], stock_data['Close'],
                              timeperiod=14)

# Print the last five rows print(stock_data.tail())
             Open   High    Low  Close   ADX
Date                                        
2020-11-24 540.40 559.99 526.20 555.38 21.16
2020-11-25 550.06 574.00 545.37 574.00 23.92
2020-11-27 581.16 598.78 578.45 585.76 26.82
2020-11-30 602.21 607.80 554.51 567.60 28.25
2020-12-01 597.59 597.85 572.05 584.76 29.58
การเทรดทางการเงินด้วย Python

การพล็อตกราฟ ADX

import matplotlib.pyplot as plt

# Create subplots
fig, (ax1, ax2) = plt.subplots(2)

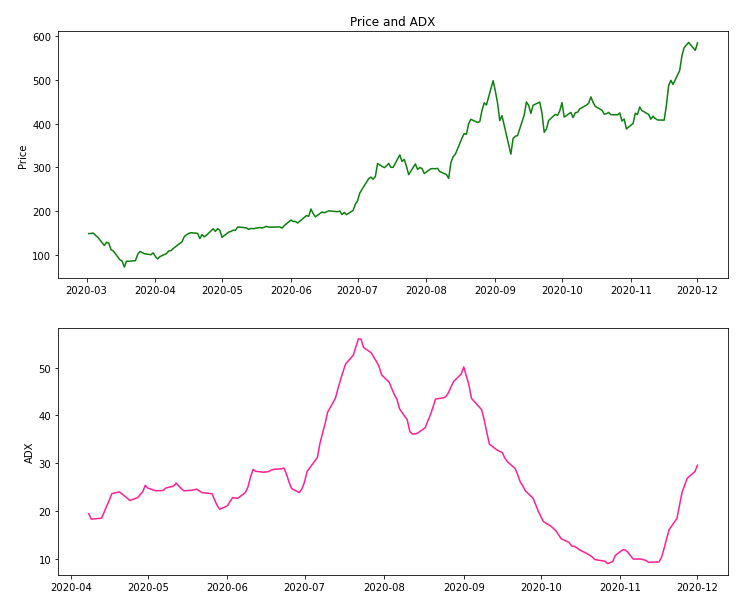
# Plot ADX with the price ax1.set_ylabel('Price') ax1.plot(stock_data['Close']) ax2.set_ylabel('ADX') ax2.plot(stock_data['ADX']) ax1.set_title('Price and ADX') plt.show()

กราฟราคาด้านบนและกราฟ ADX ด้านล่าง

การเทรดทางการเงินด้วย Python

มาฝึกกันเถอะ!

การเทรดทางการเงินด้วย Python

Preparing Video For Download...