Stats: sum and quantile

การสร้างภาพข้อมูลระดับกลางด้วย ggplot2

Rick Scavetta

Founder, Scavetta Academy

ทบทวนจากคอร์ส 1

สาเหตุของ Over-plotting วิธีแก้ไข
1. ชุดข้อมูลขนาดใหญ่ Alpha-blending, วงกลมกลวง, ขนาดจุด
2. ค่าที่ตรงกันบนแกนเดียว เหมือนข้างต้น บวกกับเปลี่ยน position
3. ข้อมูลความละเอียดต่ำ Position: jitter
4. ข้อมูลจำนวนเต็ม Position: jitter
การสร้างภาพข้อมูลระดับกลางด้วย ggplot2

พล็อตจำนวนนับเพื่อแก้ปัญหา Over-plotting

สาเหตุของ Over-plotting วิธีแก้ไข ที่นี่...
1. ชุดข้อมูลขนาดใหญ่ Alpha-blending, วงกลมกลวง, ขนาดจุด
2. ค่าที่ตรงกันบนแกนเดียว เหมือนข้างต้น บวกกับเปลี่ยน position
3. ข้อมูลความละเอียดต่ำ Position: jitter geom_count()
4. ข้อมูลจำนวนเต็ม Position: jitter geom_count()
การสร้างภาพข้อมูลระดับกลางด้วย ggplot2

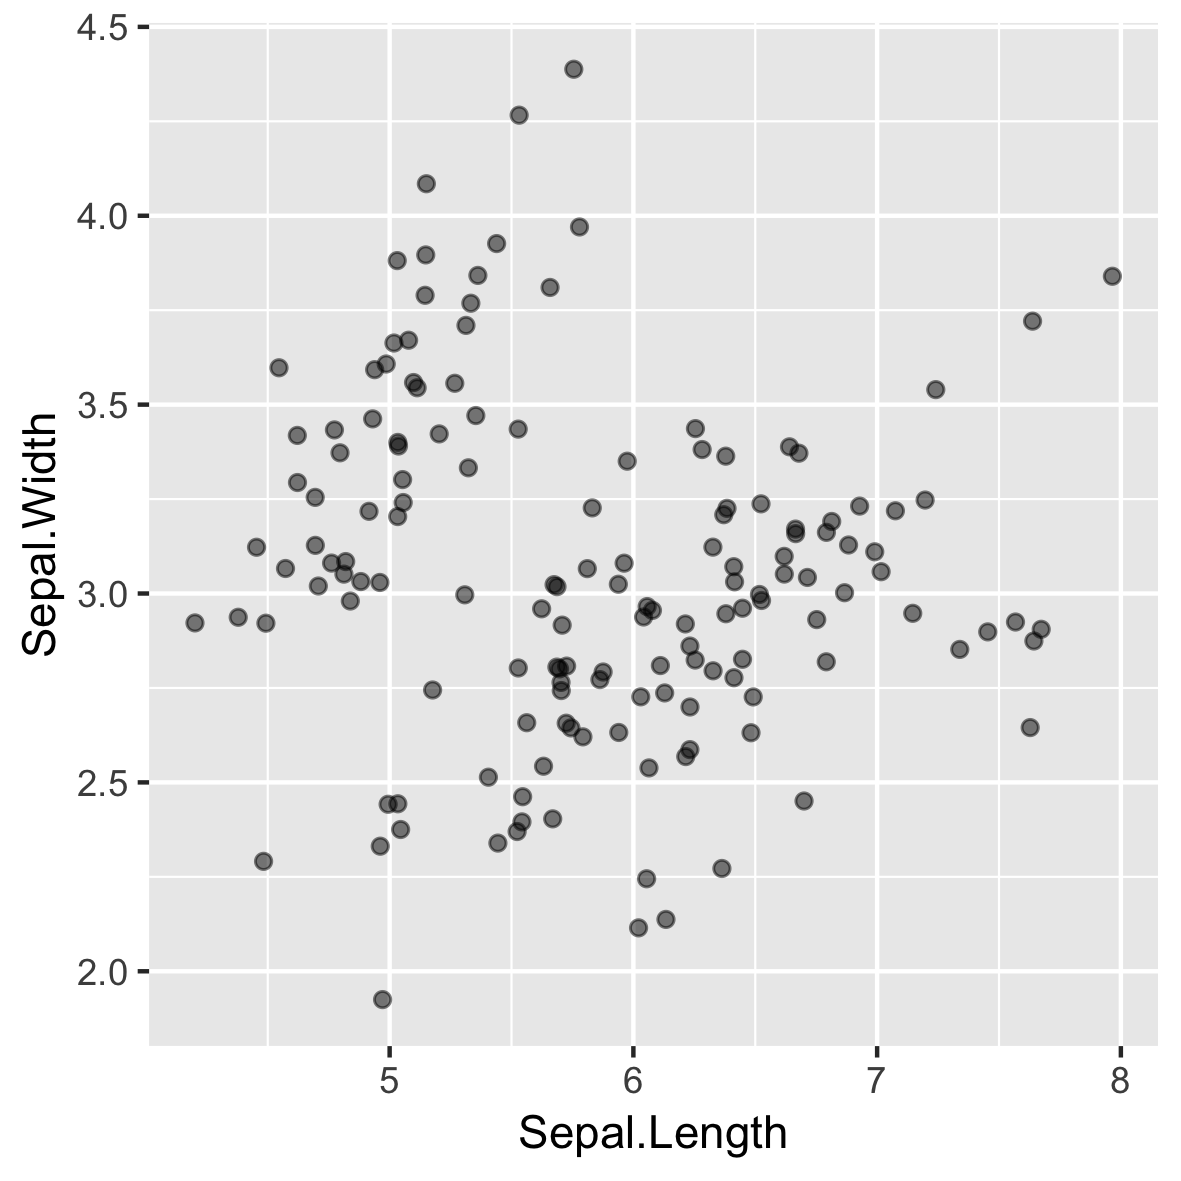
ข้อมูลความละเอียดต่ำ (และข้อมูลจำนวนเต็ม)
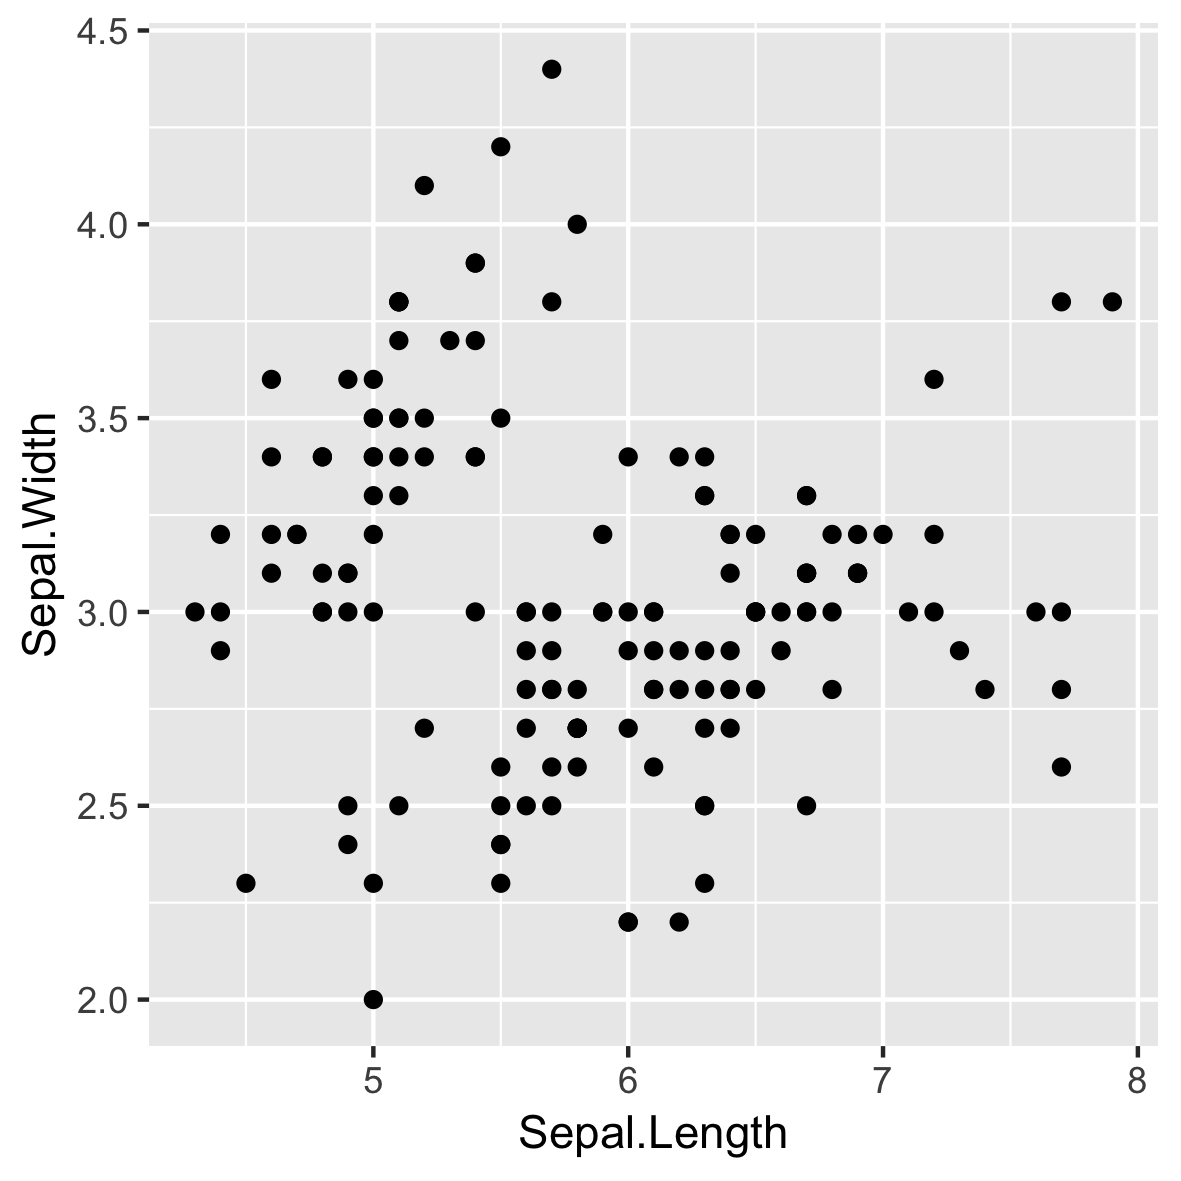
p <- ggplot(iris, aes(Sepal.Length, 
                      Sepal.Width))

p + geom_point()

การสร้างภาพข้อมูลระดับกลางด้วย ggplot2

Jittering อาจทำให้เข้าใจผิดได้

p + geom_jitter(alpha = 0.5,
                width = 0.1,
                height = 0.1)

การสร้างภาพข้อมูลระดับกลางด้วย ggplot2

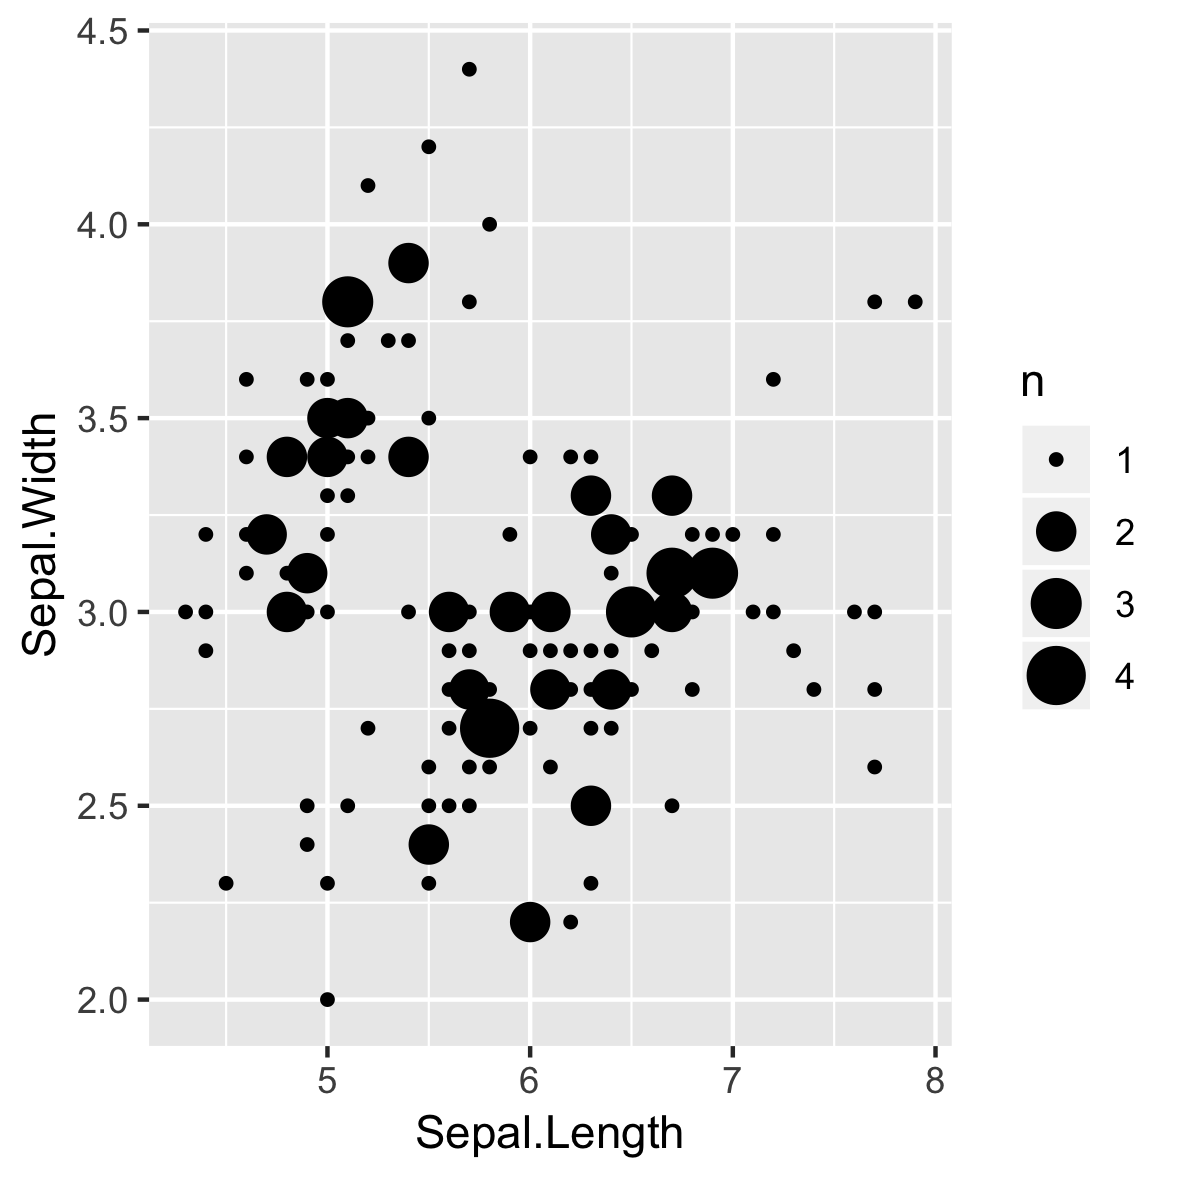
geom_count()

p + 
  geom_count()

การสร้างภาพข้อมูลระดับกลางด้วย ggplot2

ความสัมพันธ์ระหว่าง geom และ stat

geom_ stat_
geom_count() stat_sum()
การสร้างภาพข้อมูลระดับกลางด้วย ggplot2

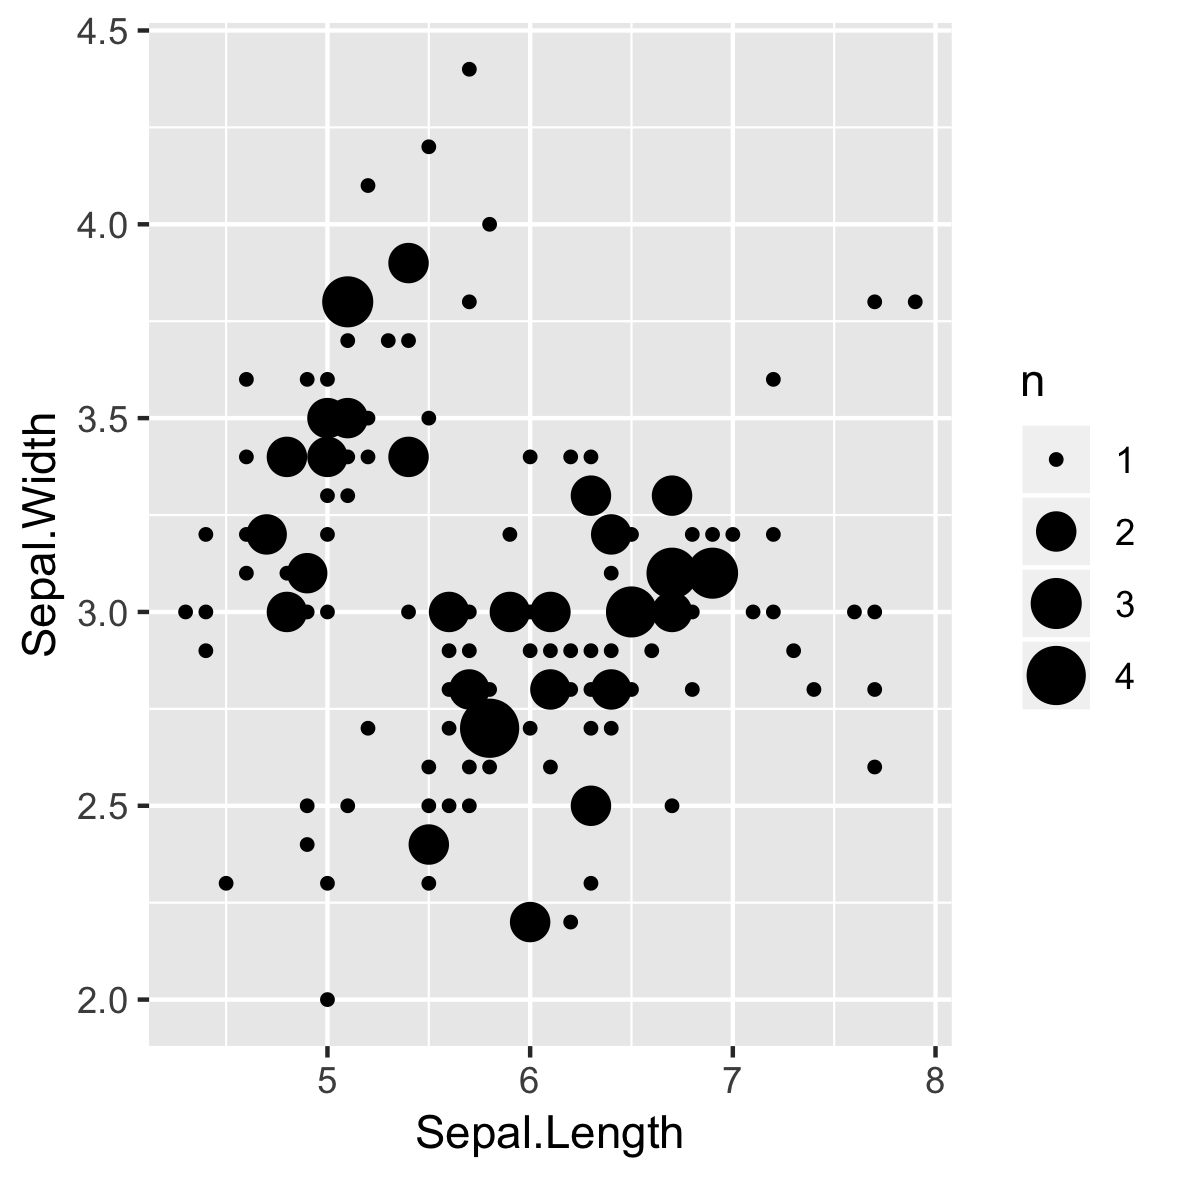
stat_sum()

p + 
  stat_sum()

การสร้างภาพข้อมูลระดับกลางด้วย ggplot2

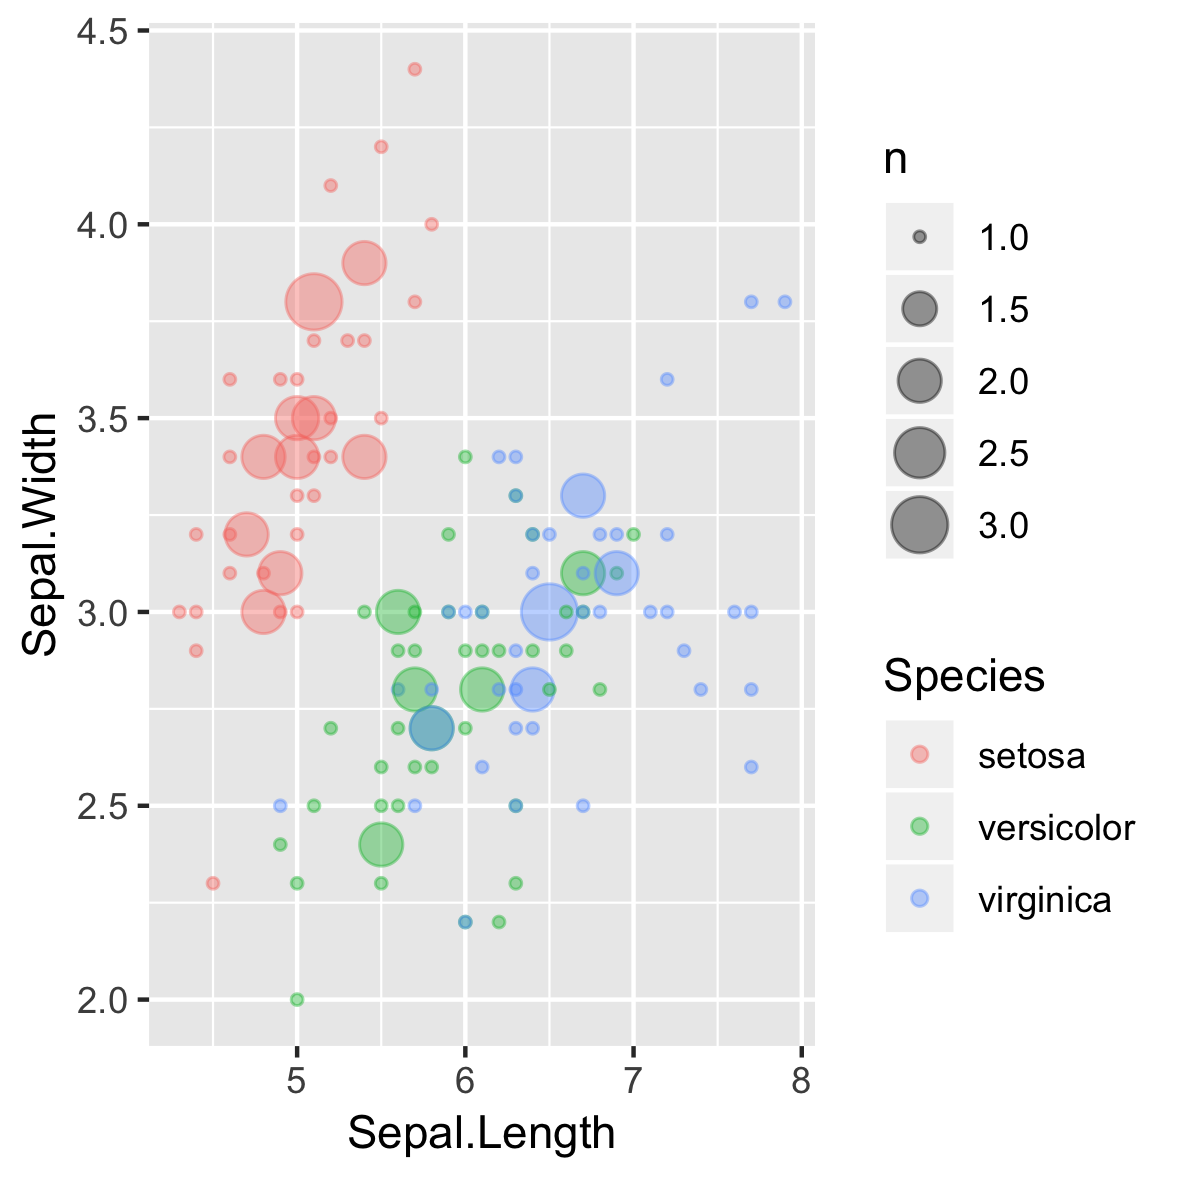
Over-plotting ยังคงเป็นปัญหาอยู่!

ggplot(iris, aes(Sepal.Length,
                 Sepal.Width, 
                 color = Species)) + 
  geom_count(alpha = 0.4)

การสร้างภาพข้อมูลระดับกลางด้วย ggplot2

geom_quantile()

ggplot(iris, aes(Sepal.Length,
                 Sepal.Width, 
                 color = Species)) + 
  geom_count(alpha = 0.4)
การสร้างภาพข้อมูลระดับกลางด้วย ggplot2

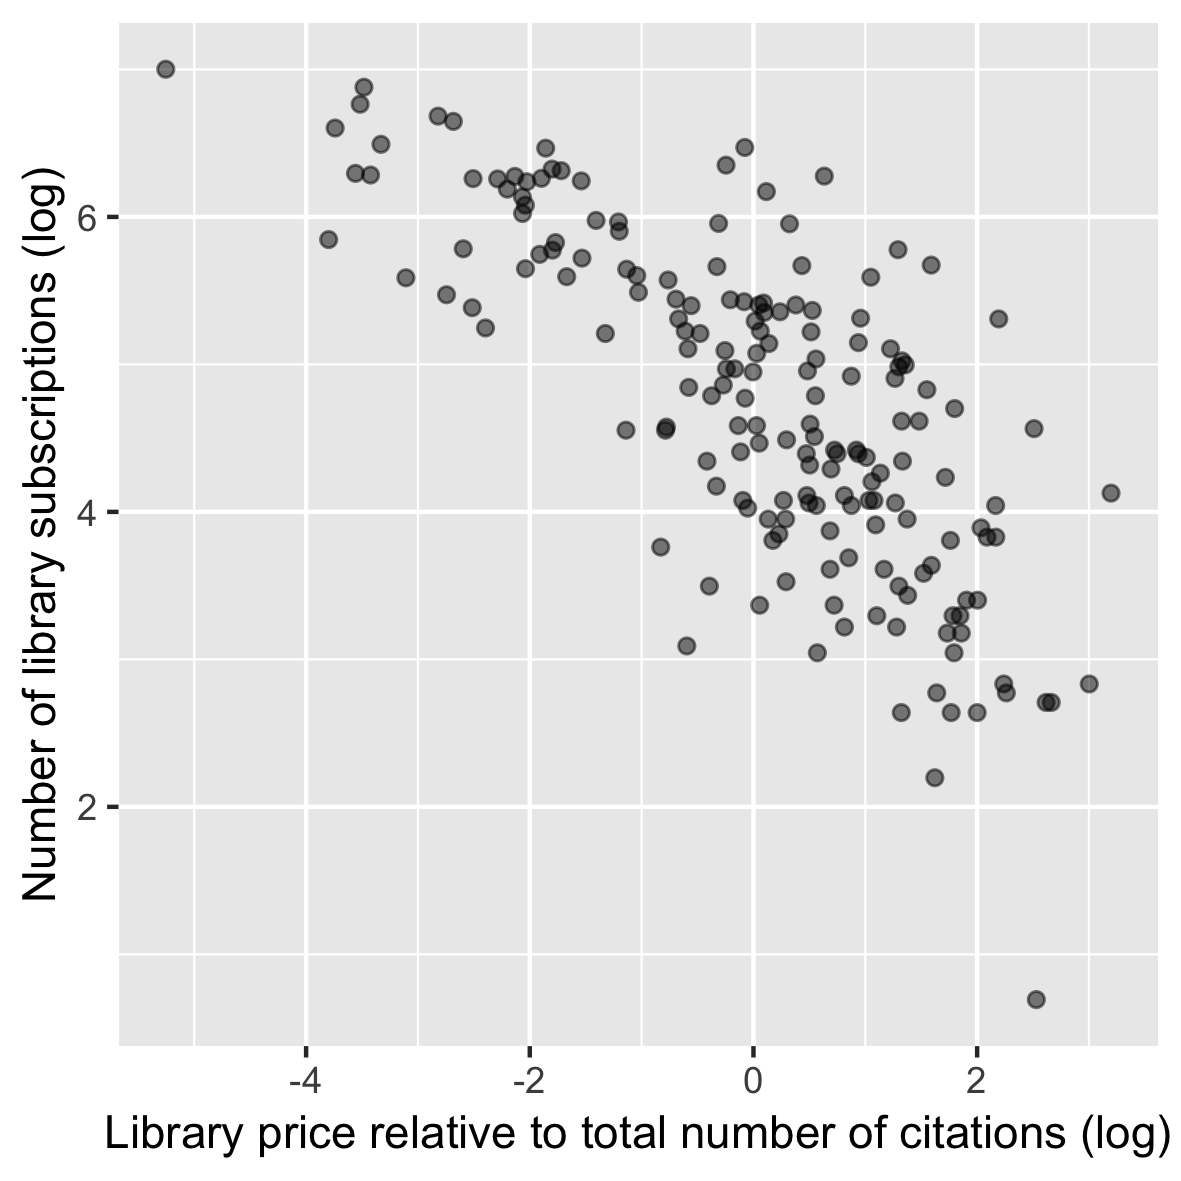
การจัดการกับ Heteroscedasticity

library(AER)
data(Journals)

p <- ggplot(Journals, 
            aes(log(price/citations), 
                log(subs))) +
  geom_point(alpha = 0.5) +
  labs(...)

p

การสร้างภาพข้อมูลระดับกลางด้วย ggplot2

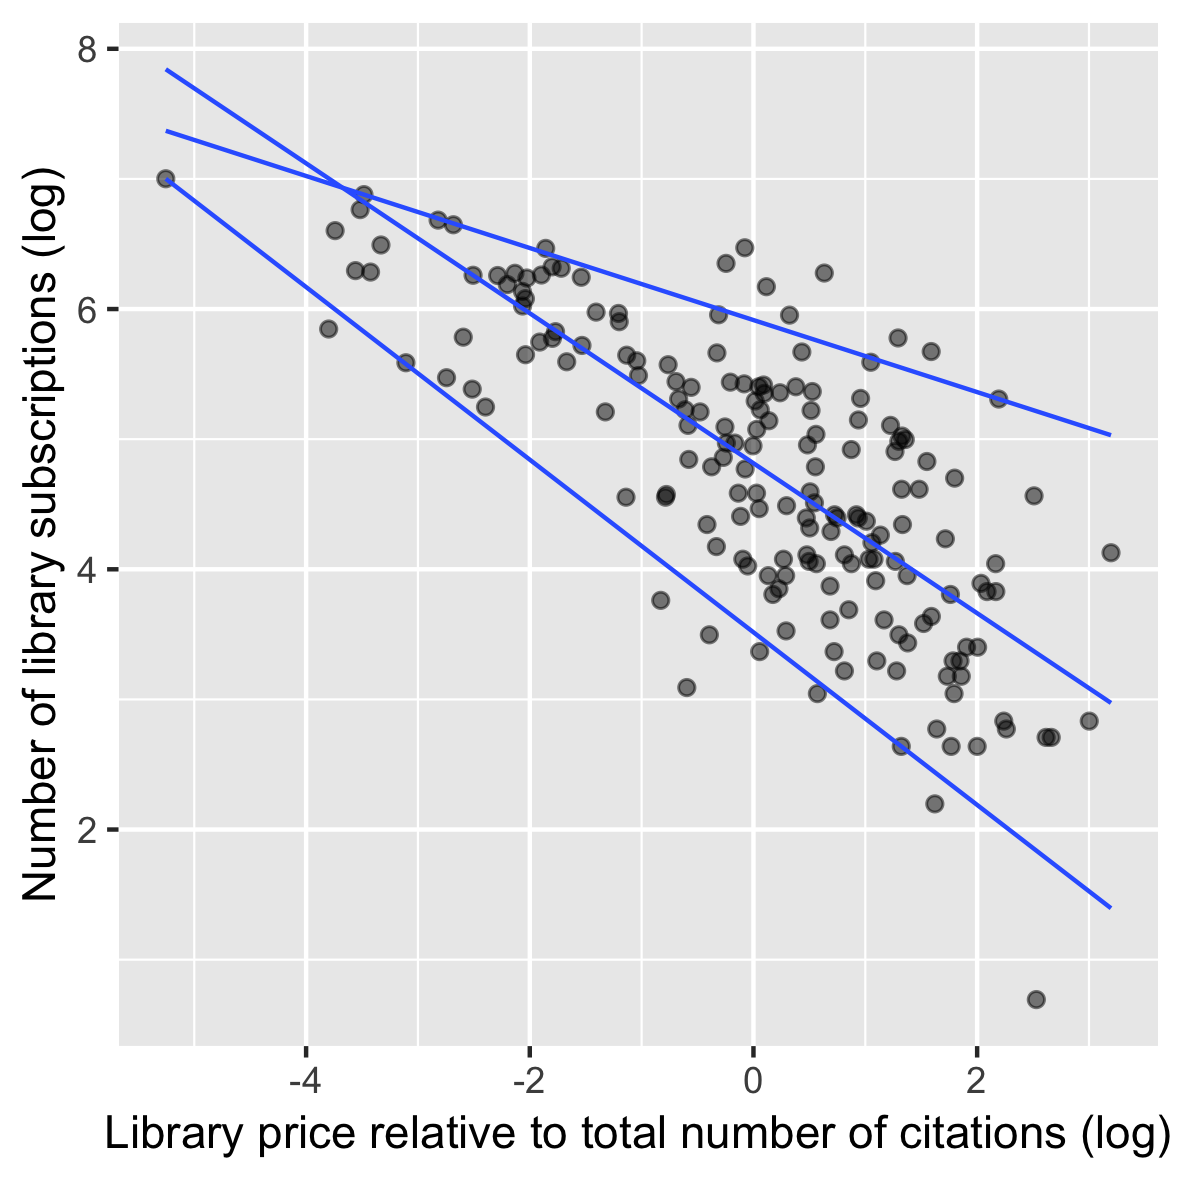
การใช้ geom_quantile

p +
  geom_quantile(quantiles = 
                c(0.05, 0.50, 0.95))

การสร้างภาพข้อมูลระดับกลางด้วย ggplot2

ความสัมพันธ์ระหว่าง geom และ stat

geom_ stat_
geom_count() stat_sum()
geom_quantile() stat_quantile()
การสร้างภาพข้อมูลระดับกลางด้วย ggplot2

มาฝึกกันเถอะ!

การสร้างภาพข้อมูลระดับกลางด้วย ggplot2

Preparing Video For Download...