เลเยอร์ Coordinates

การสร้างภาพข้อมูลระดับกลางด้วย ggplot2

Rick Scavetta

Founder, Scavetta Academy

เลเยอร์ Coordinates

  • ควบคุมขนาดพล็อต
  • coord_
    • เช่น coord_cartesian()
การสร้างภาพข้อมูลระดับกลางด้วย ggplot2

การซูมเข้า

  • coord_cartesian(xlim = ...)
  • scale_x_continuous(limits = ...)
  • xlim(...)
การสร้างภาพข้อมูลระดับกลางด้วย ggplot2

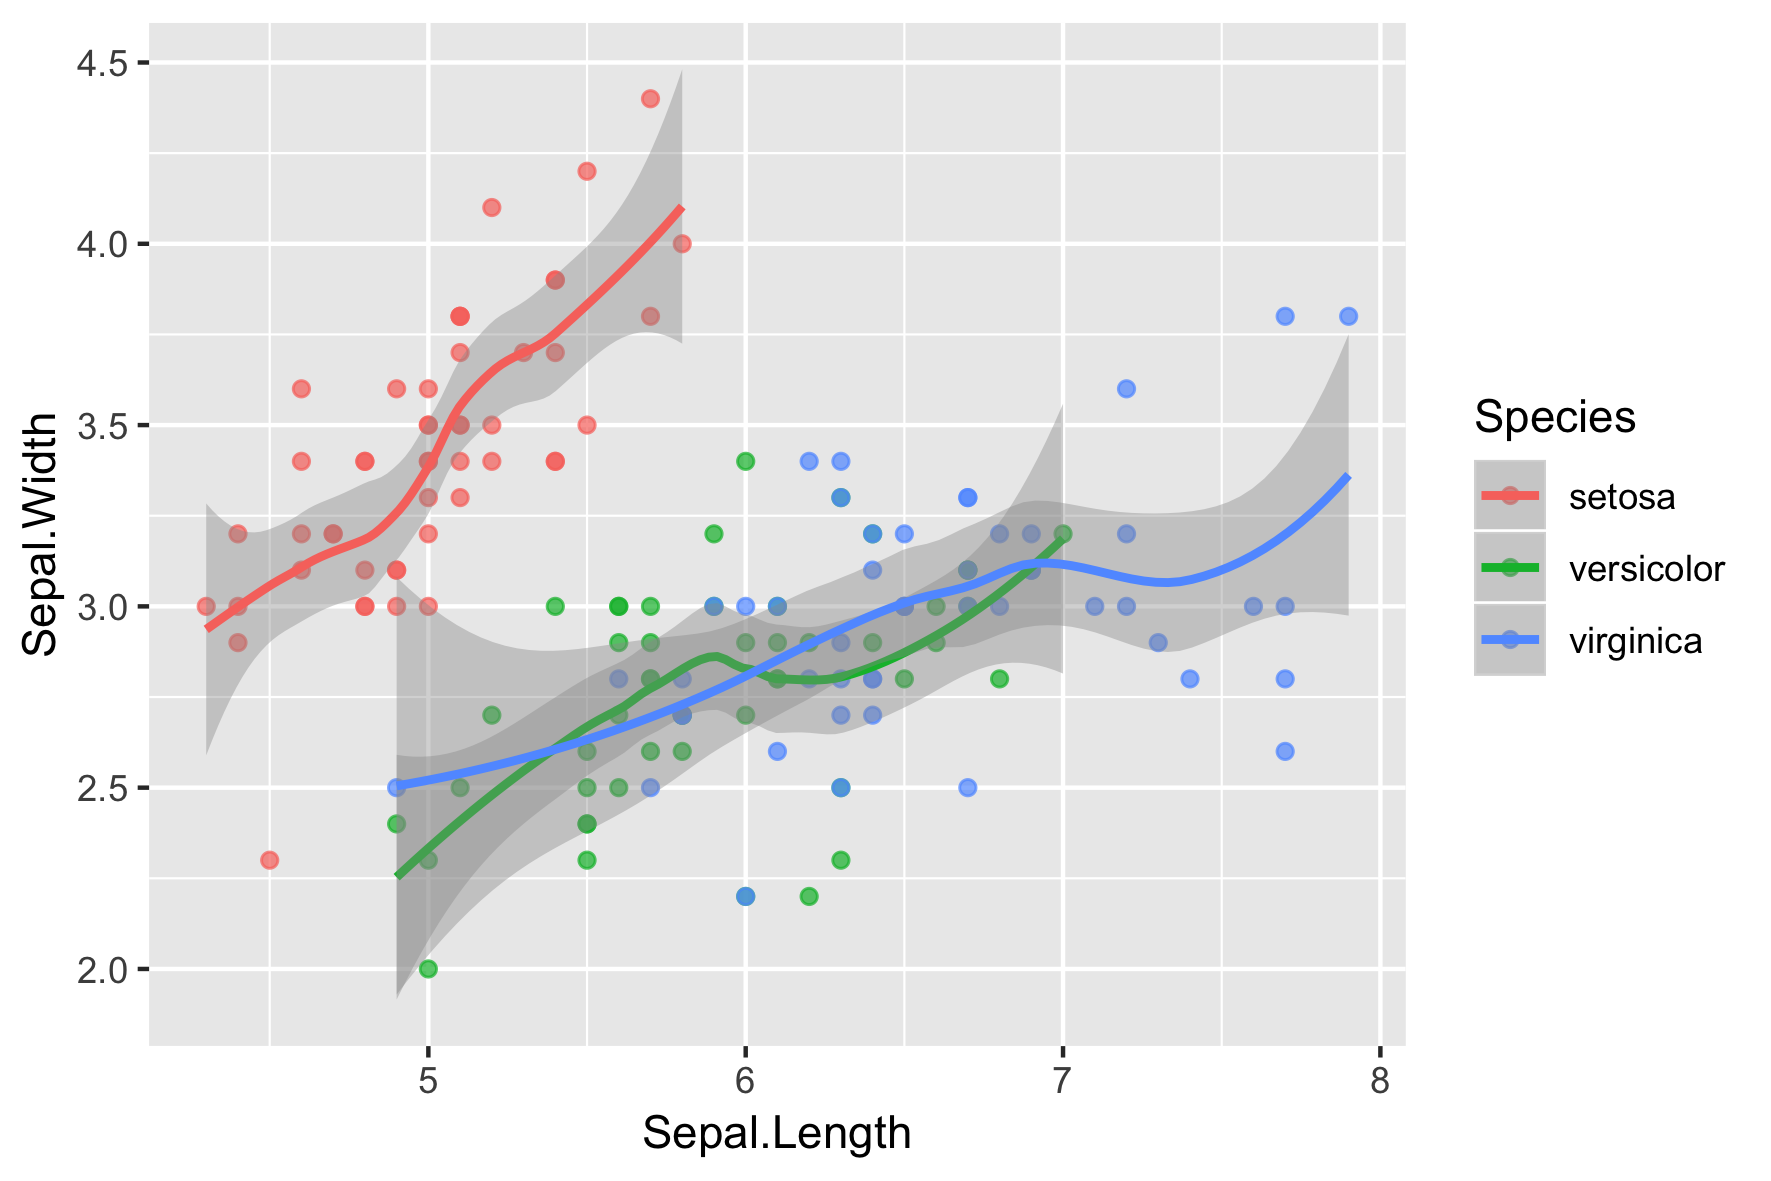
พล็อตต้นฉบับ

iris.smooth <- ggplot(
  iris, 
  aes(x = Sepal.Length, 
      y = Sepal.Width, 
      color = Species)
  ) + 
  geom_point(alpha = 0.7) +
  geom_smooth()

iris.smooth 

การสร้างภาพข้อมูลระดับกลางด้วย ggplot2

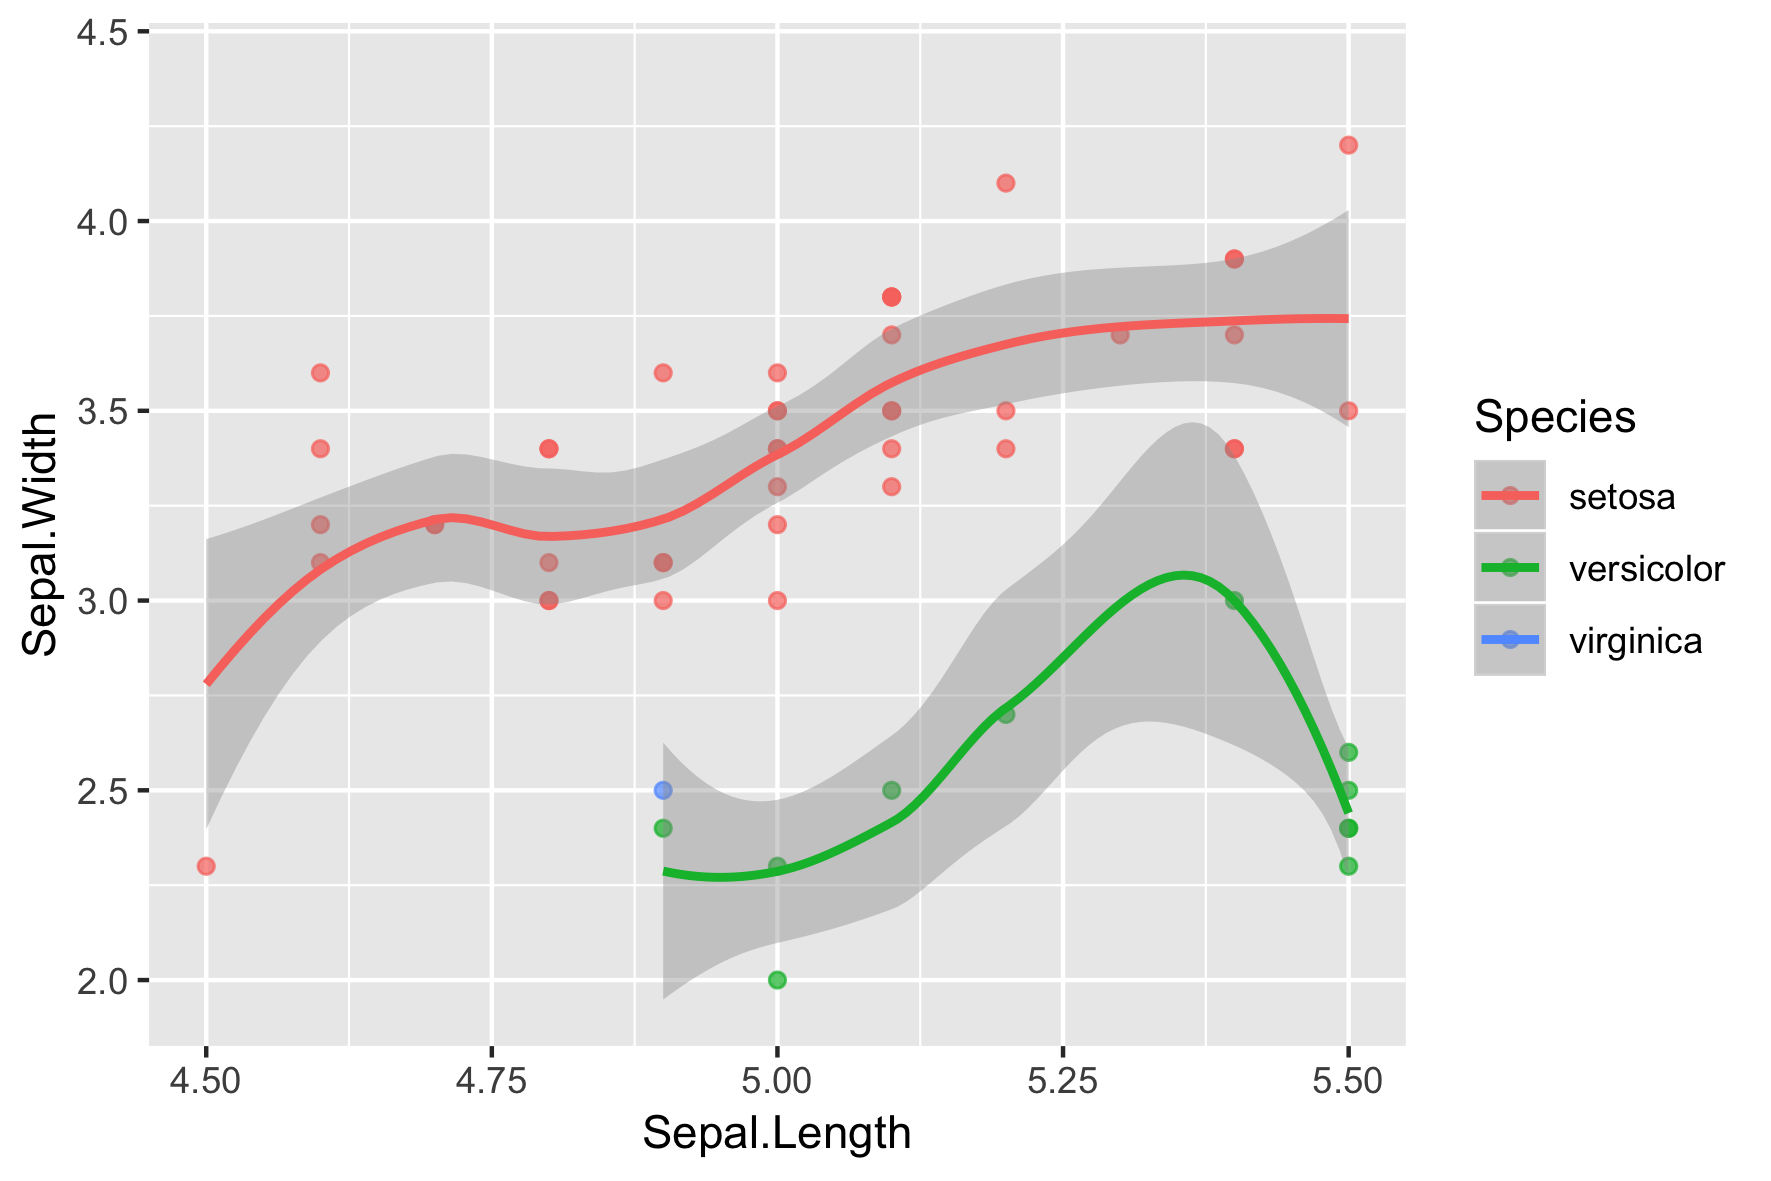
scale_x_continuous()

iris.smooth + 
  scale_x_continuous(limits = c(4.5, 5.5))
Removed 95 rows containing non-finite values 
(stat_smooth).
Removed 95 rows containing missing values 
(geom_point).

การสร้างภาพข้อมูลระดับกลางด้วย ggplot2

scale_x_continuous()

พล็อตต้นฉบับ

ซูมเข้าด้วย scale_x_continuous()

ข้อมูลบางส่วนถูกกรองออกไป!

การสร้างภาพข้อมูลระดับกลางด้วย ggplot2

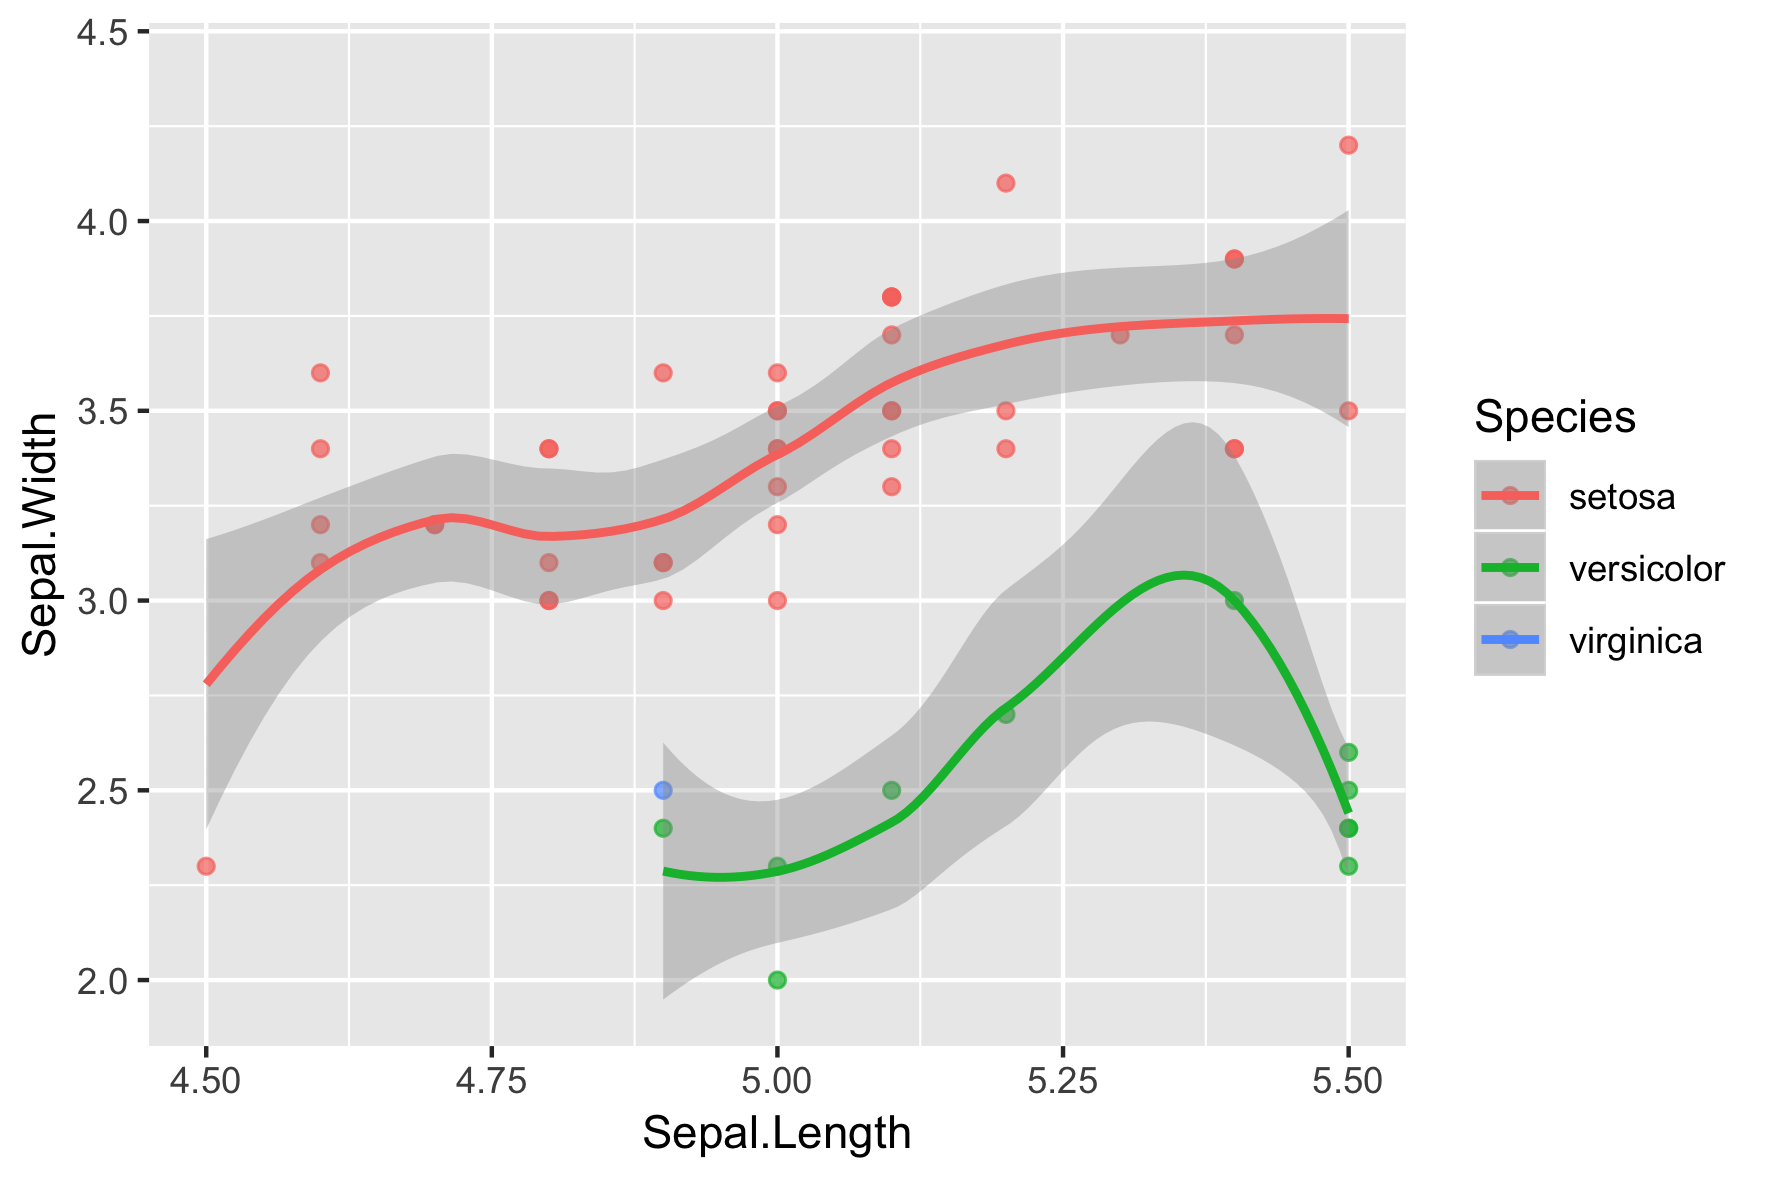
xlim()

iris.smooth +
  xlim(c(4.5, 5.5))
Removed 95 rows containing non-finite values 
(stat_smooth).
Removed 95 rows containing missing values 
(geom_point).

การสร้างภาพข้อมูลระดับกลางด้วย ggplot2

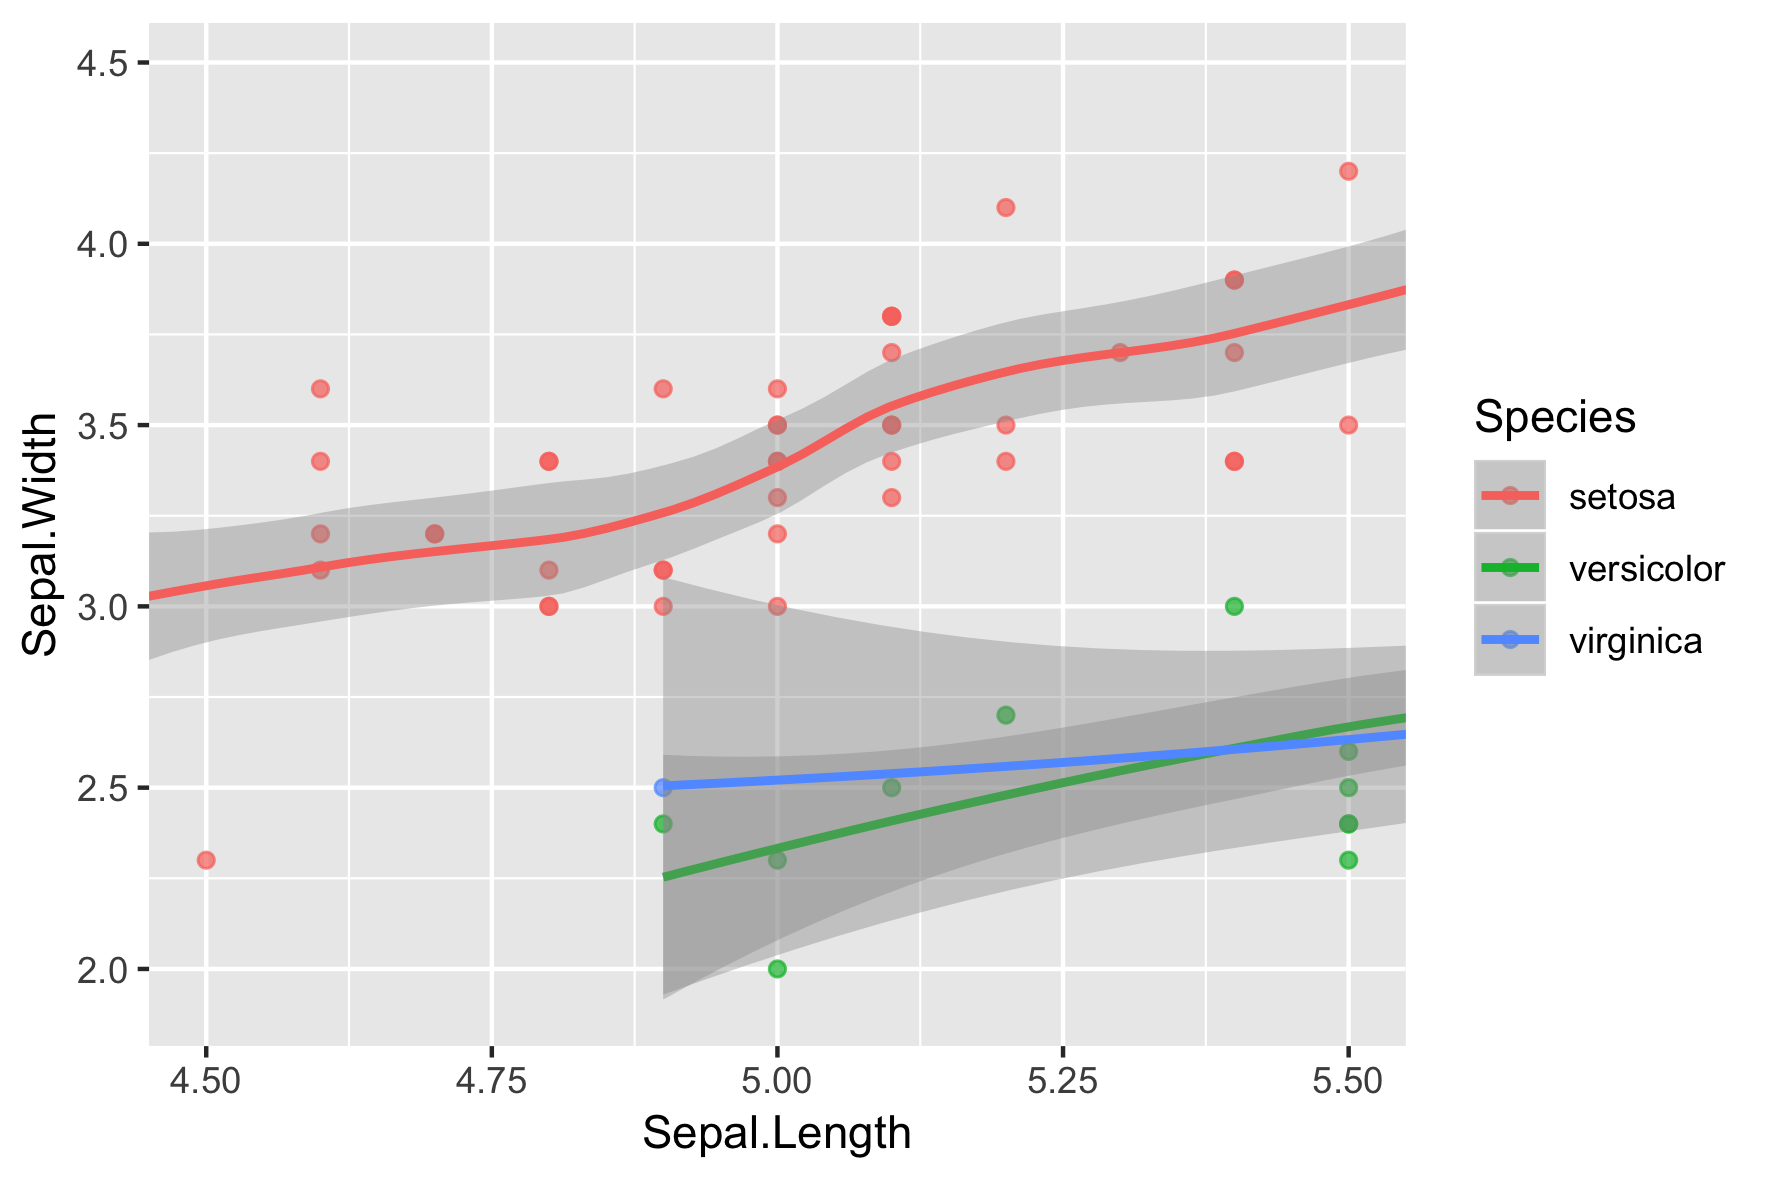
coord_cartesian()

iris.smooth +
  coord_cartesian(xlim = c(4.5, 5.5))

การสร้างภาพข้อมูลระดับกลางด้วย ggplot2

อัตราส่วนภาพ

  • อัตราส่วนความสูงต่อความกว้าง
  • ระวังการแสดงผลที่อาจทำให้เข้าใจผิด!
  • ยังไม่มีมาตรฐานสากล
  • โดยทั่วไปใช้ 1:1 เมื่อข้อมูลอยู่ในสเกลเดียวกัน
การสร้างภาพข้อมูลระดับกลางด้วย ggplot2

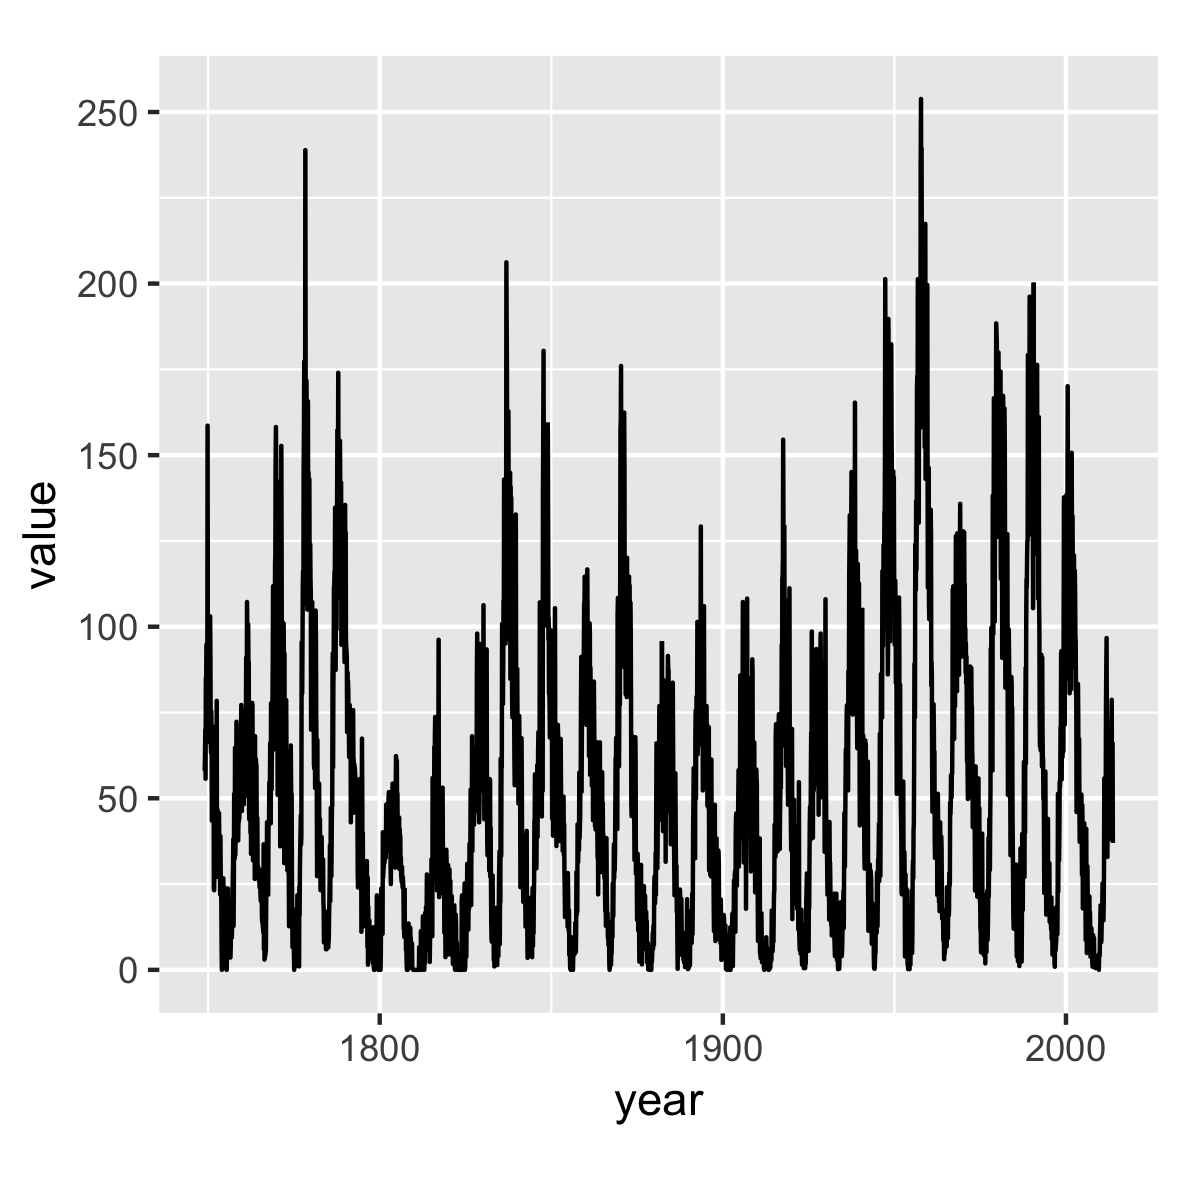
จุดมืดบนดวงอาทิตย์

library(zoo)
sunspots.m <- data.frame(
    year = index(sunspot.month),
    value = reshape2::melt(sunspot.month)$value)
)

ggplot(sunspots.m, aes(x = year, y = value)) +
  geom_line() +
  coord_fixed() # default to 1:1 aspect ratio

การสร้างภาพข้อมูลระดับกลางด้วย ggplot2

จุดมืดบนดวงอาทิตย์

ggplot(sunspots.m, aes(x = year, y = value)) +
  geom_line() +
  coord_fixed(0.055)

การสร้างภาพข้อมูลระดับกลางด้วย ggplot2

ถึงเวลาฝึกแล้ว!

การสร้างภาพข้อมูลระดับกลางด้วย ggplot2

Preparing Video For Download...