Facet wrap และ margins

การสร้างภาพข้อมูลระดับกลางด้วย ggplot2

Rick Scavetta

Founder, Scavetta Academy

การปรับพื้นที่การพล็อต
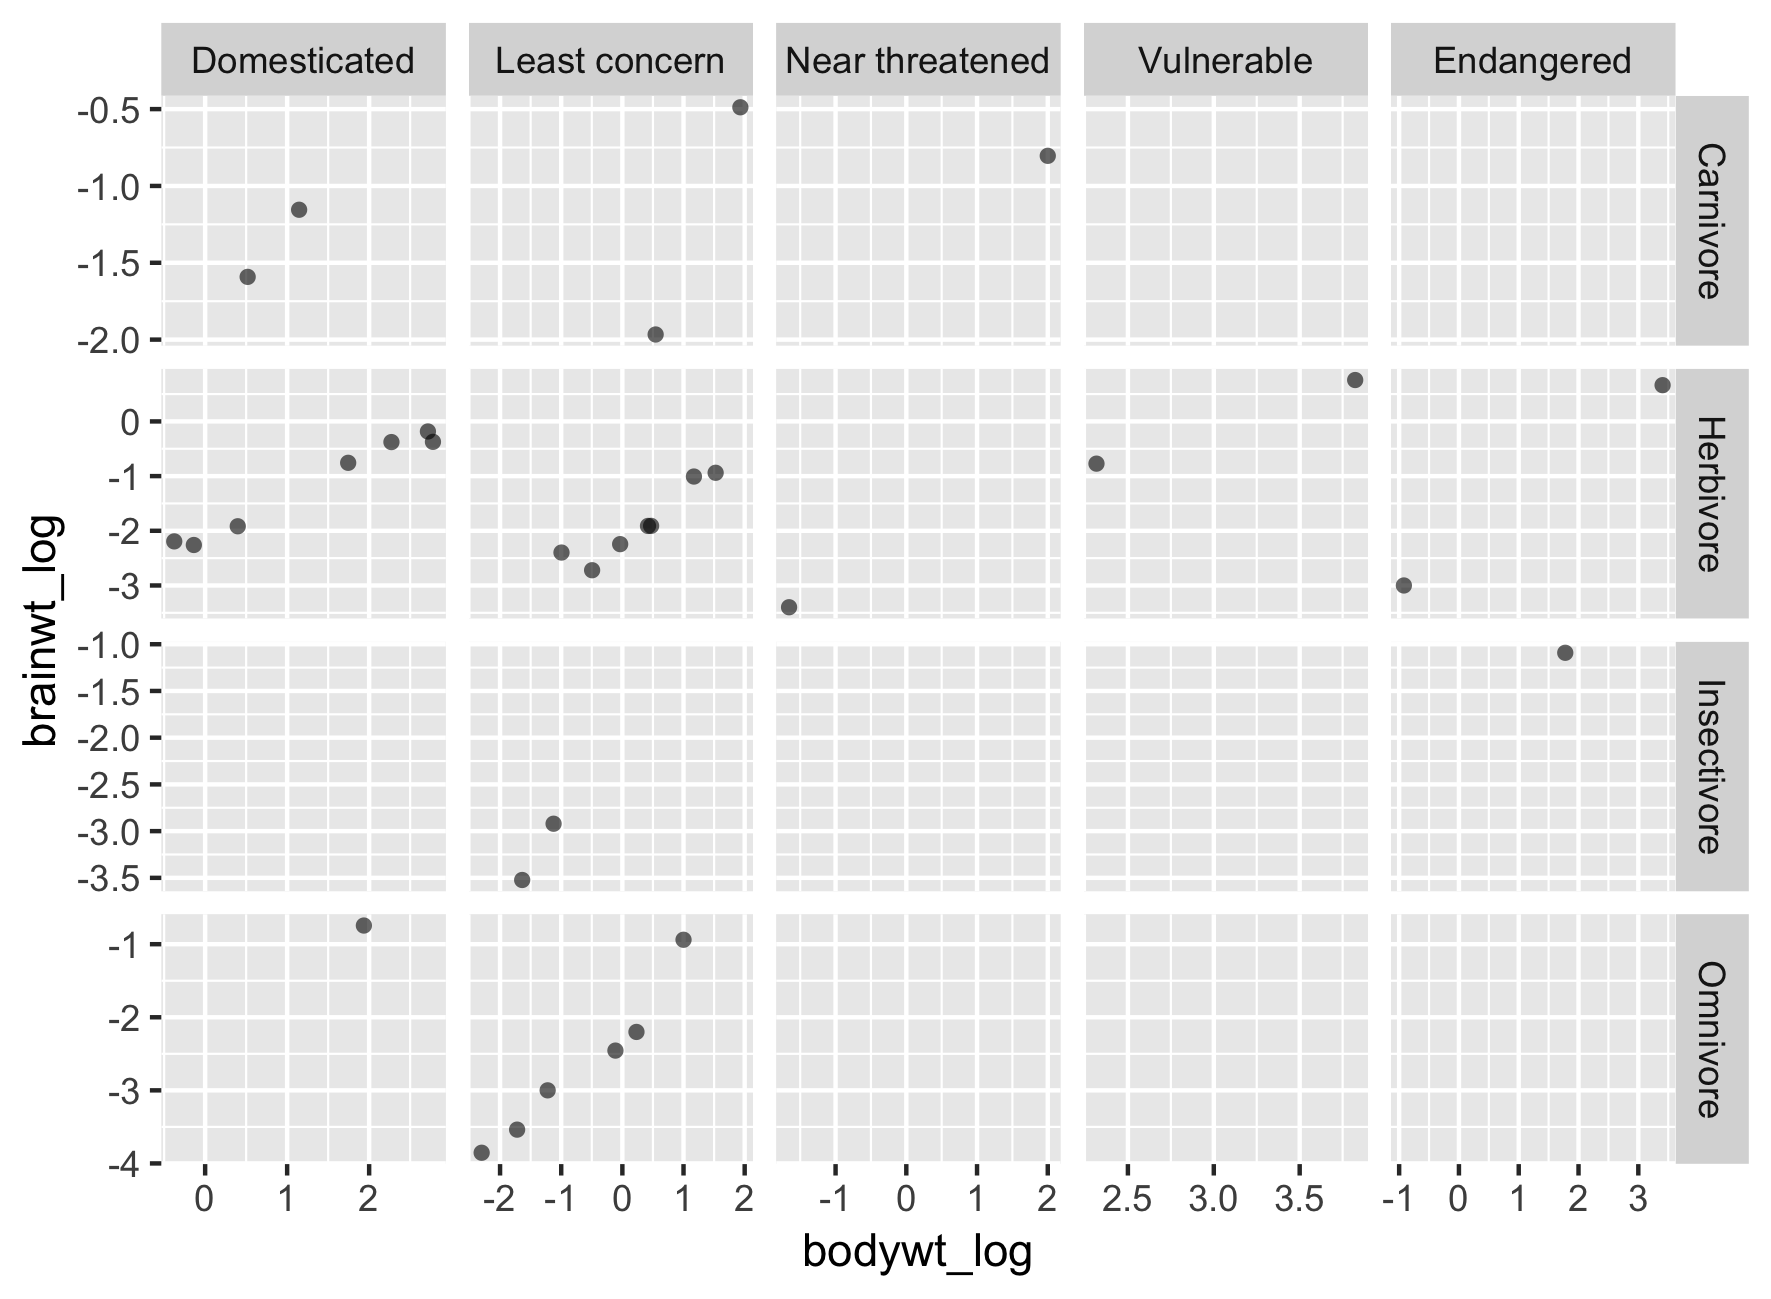
ggplot(msleep2, aes(bodywt_log, 
                    brainwt_log)) +
  geom_point(alpha = 0.6, shape = 16) +
  facet_grid(rows = vars(vore), 
             cols = vars(conservation),
             scales = "free") 

การสร้างภาพข้อมูลระดับกลางด้วย ggplot2

การใช้ facet_wrap()

กรณีที่ใช้:

  1. เมื่อต้องการให้แกน x และ y เป็นอิสระในแต่ละพล็อต
    • กล่าวคือ ไม่ได้จำกัดแค่ต่อแถวหรือคอลัมน์อย่าง facet_grid()
การสร้างภาพข้อมูลระดับกลางด้วย ggplot2

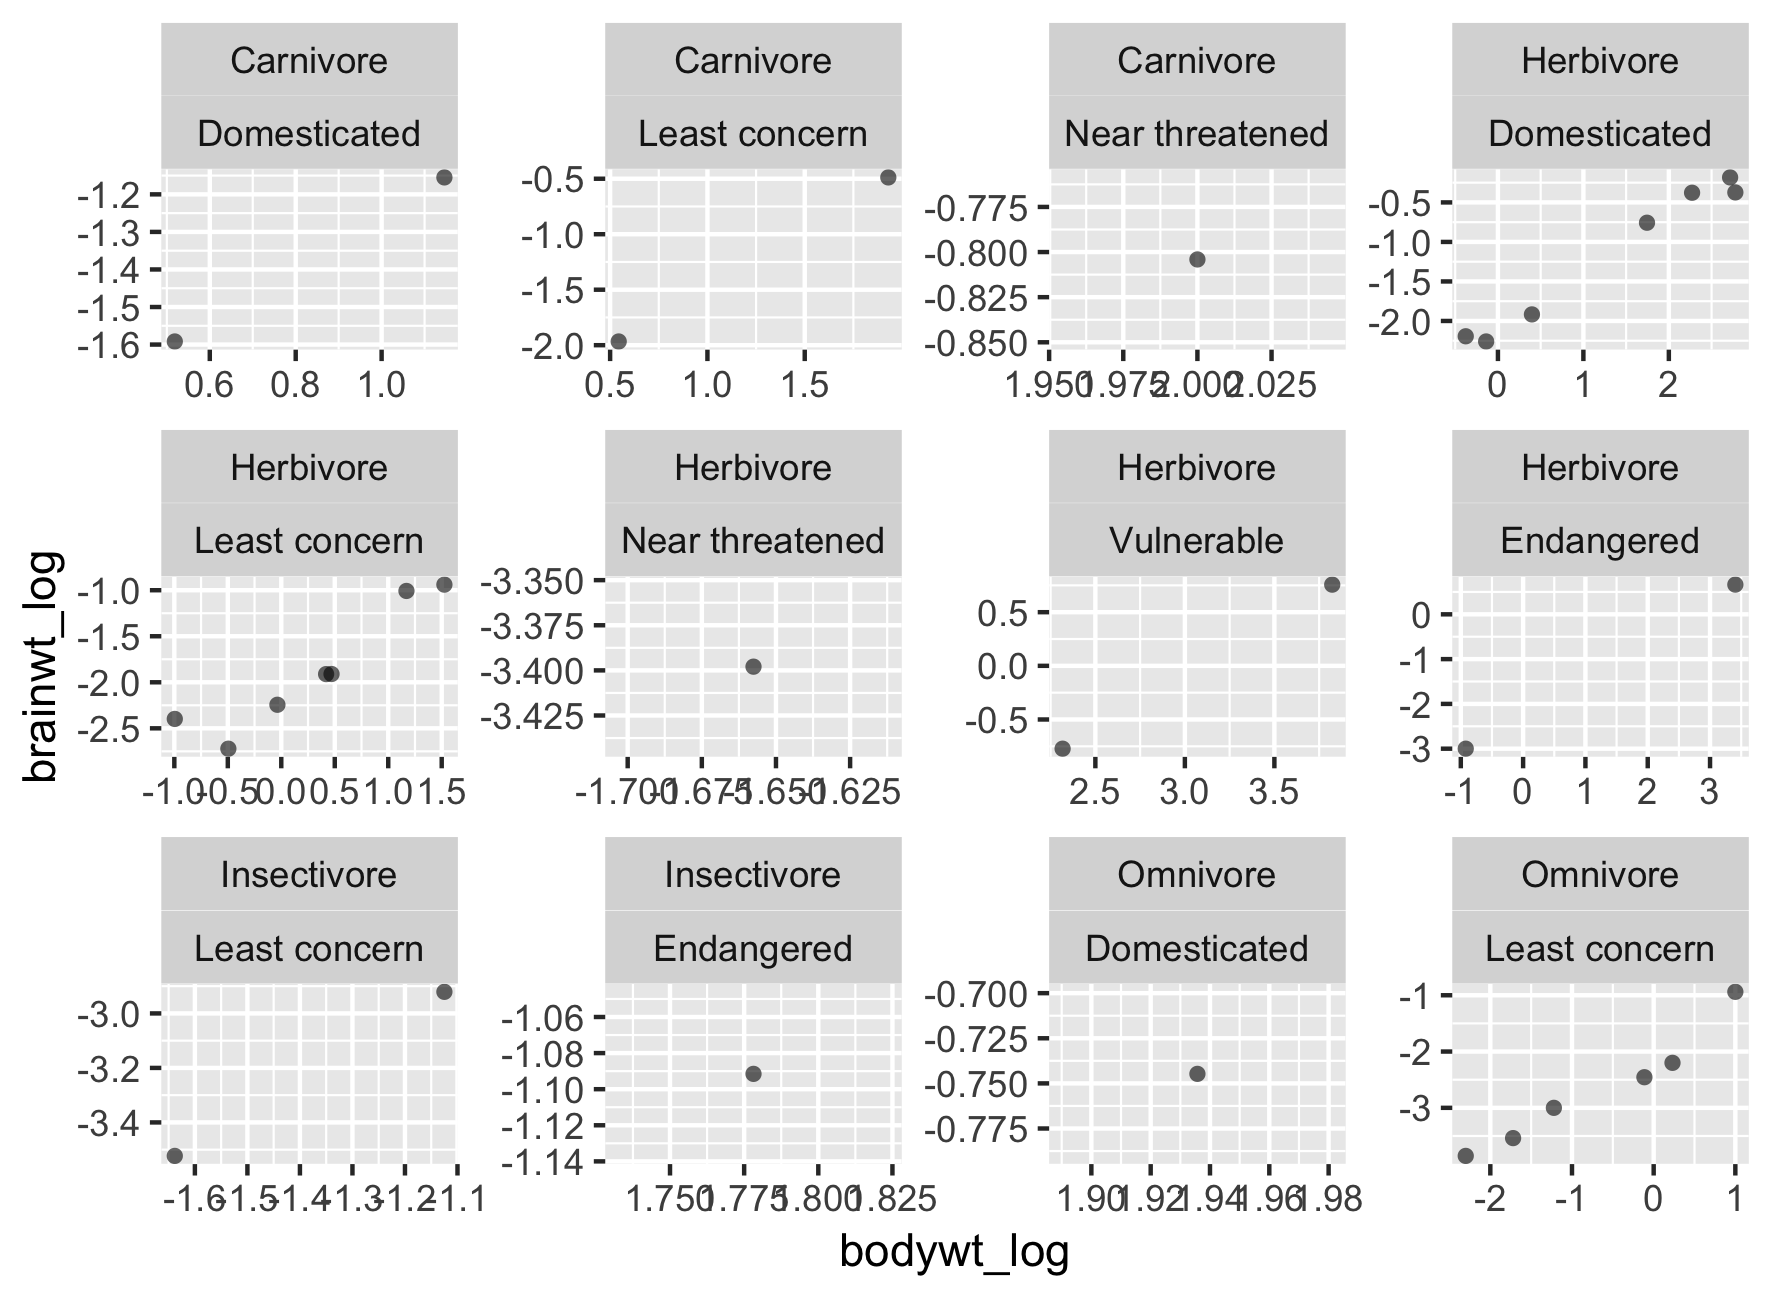
การใช้ facet_wrap() - สถานการณ์ที่ 1

ggplot(msleep2, aes(bodywt_log, 
                    brainwt_log)) +
  geom_point(alpha = 0.6, shape = 16) +
  facet_wrap(vars(vore, conservation),
             scales = "free") 

การสร้างภาพข้อมูลระดับกลางด้วย ggplot2

การใช้ facet_wrap()

กรณีที่ใช้:

  1. เมื่อต้องการให้แกน x และ y เป็นอิสระในแต่ละพล็อต
    • กล่าวคือ ไม่ได้จำกัดแค่ต่อแถวหรือคอลัมน์อย่าง facet_grid()
  2. เมื่อตัวแปรหมวดหมู่ (factor) มีหลายกลุ่ม (ระดับ)
    • กล่าวคือ มีพล็อตย่อยมากเกินกว่าจะแบ่งตามคอลัมน์หรือแถว
    • เป็นสถานการณ์ที่พบบ่อยกว่า
การสร้างภาพข้อมูลระดับกลางด้วย ggplot2

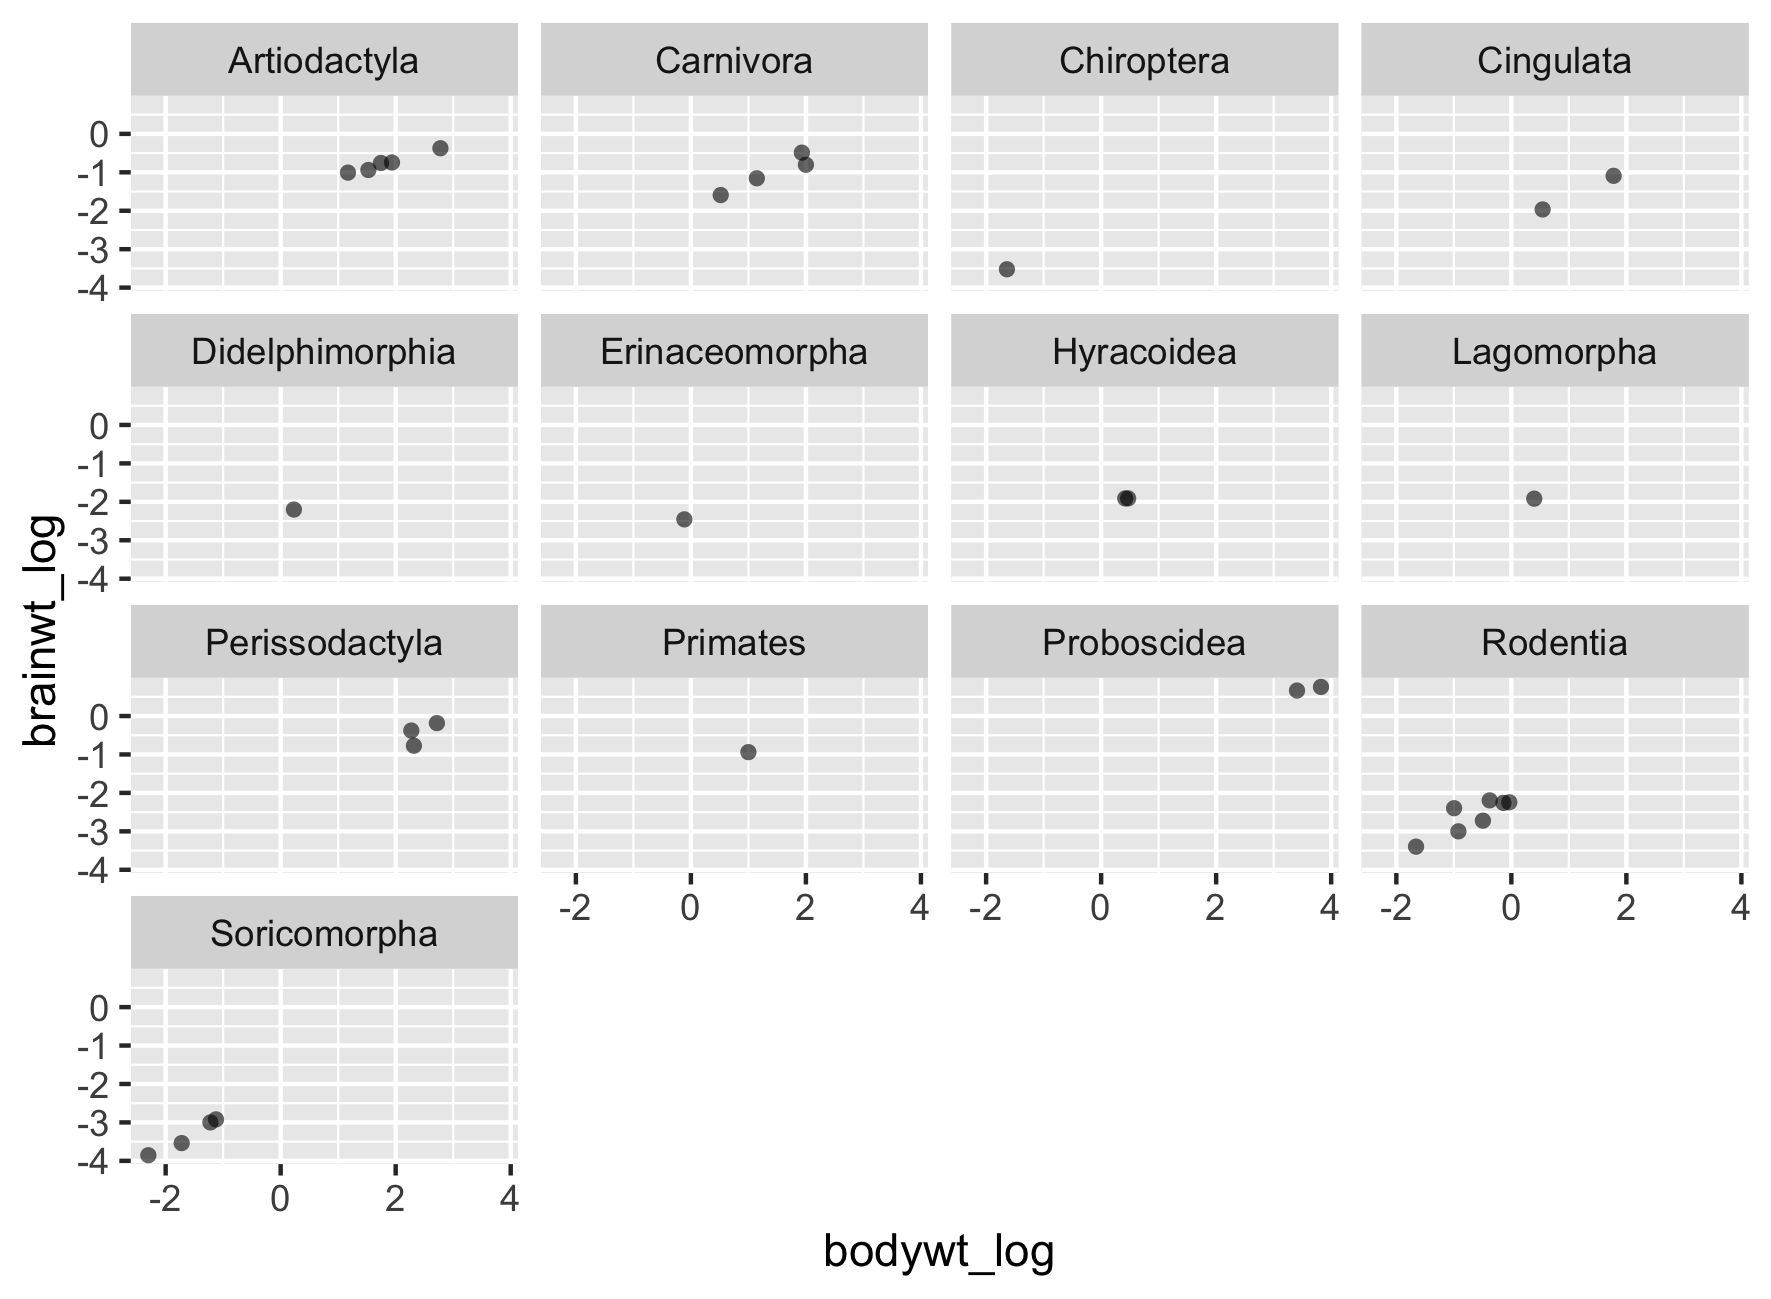
การใช้ facet_wrap() - สถานการณ์ที่ 2

ggplot(msleep2, aes(bodywt_log, 
                    brainwt_log)) +
  geom_point(alpha = 0.6, shape = 16) +
  facet_wrap(vars(order))

การสร้างภาพข้อมูลระดับกลางด้วย ggplot2

การใช้ margin plots

ggplot(msleep2, aes(bodywt_log, 
                    brainwt_log)) +
  geom_point(alpha = 0.6, shape = 16) +
  facet_grid(rows = vars(vore), 
             cols = vars(conservation),
             scales = "free") 

การสร้างภาพข้อมูลระดับกลางด้วย ggplot2

การใช้ margin plots

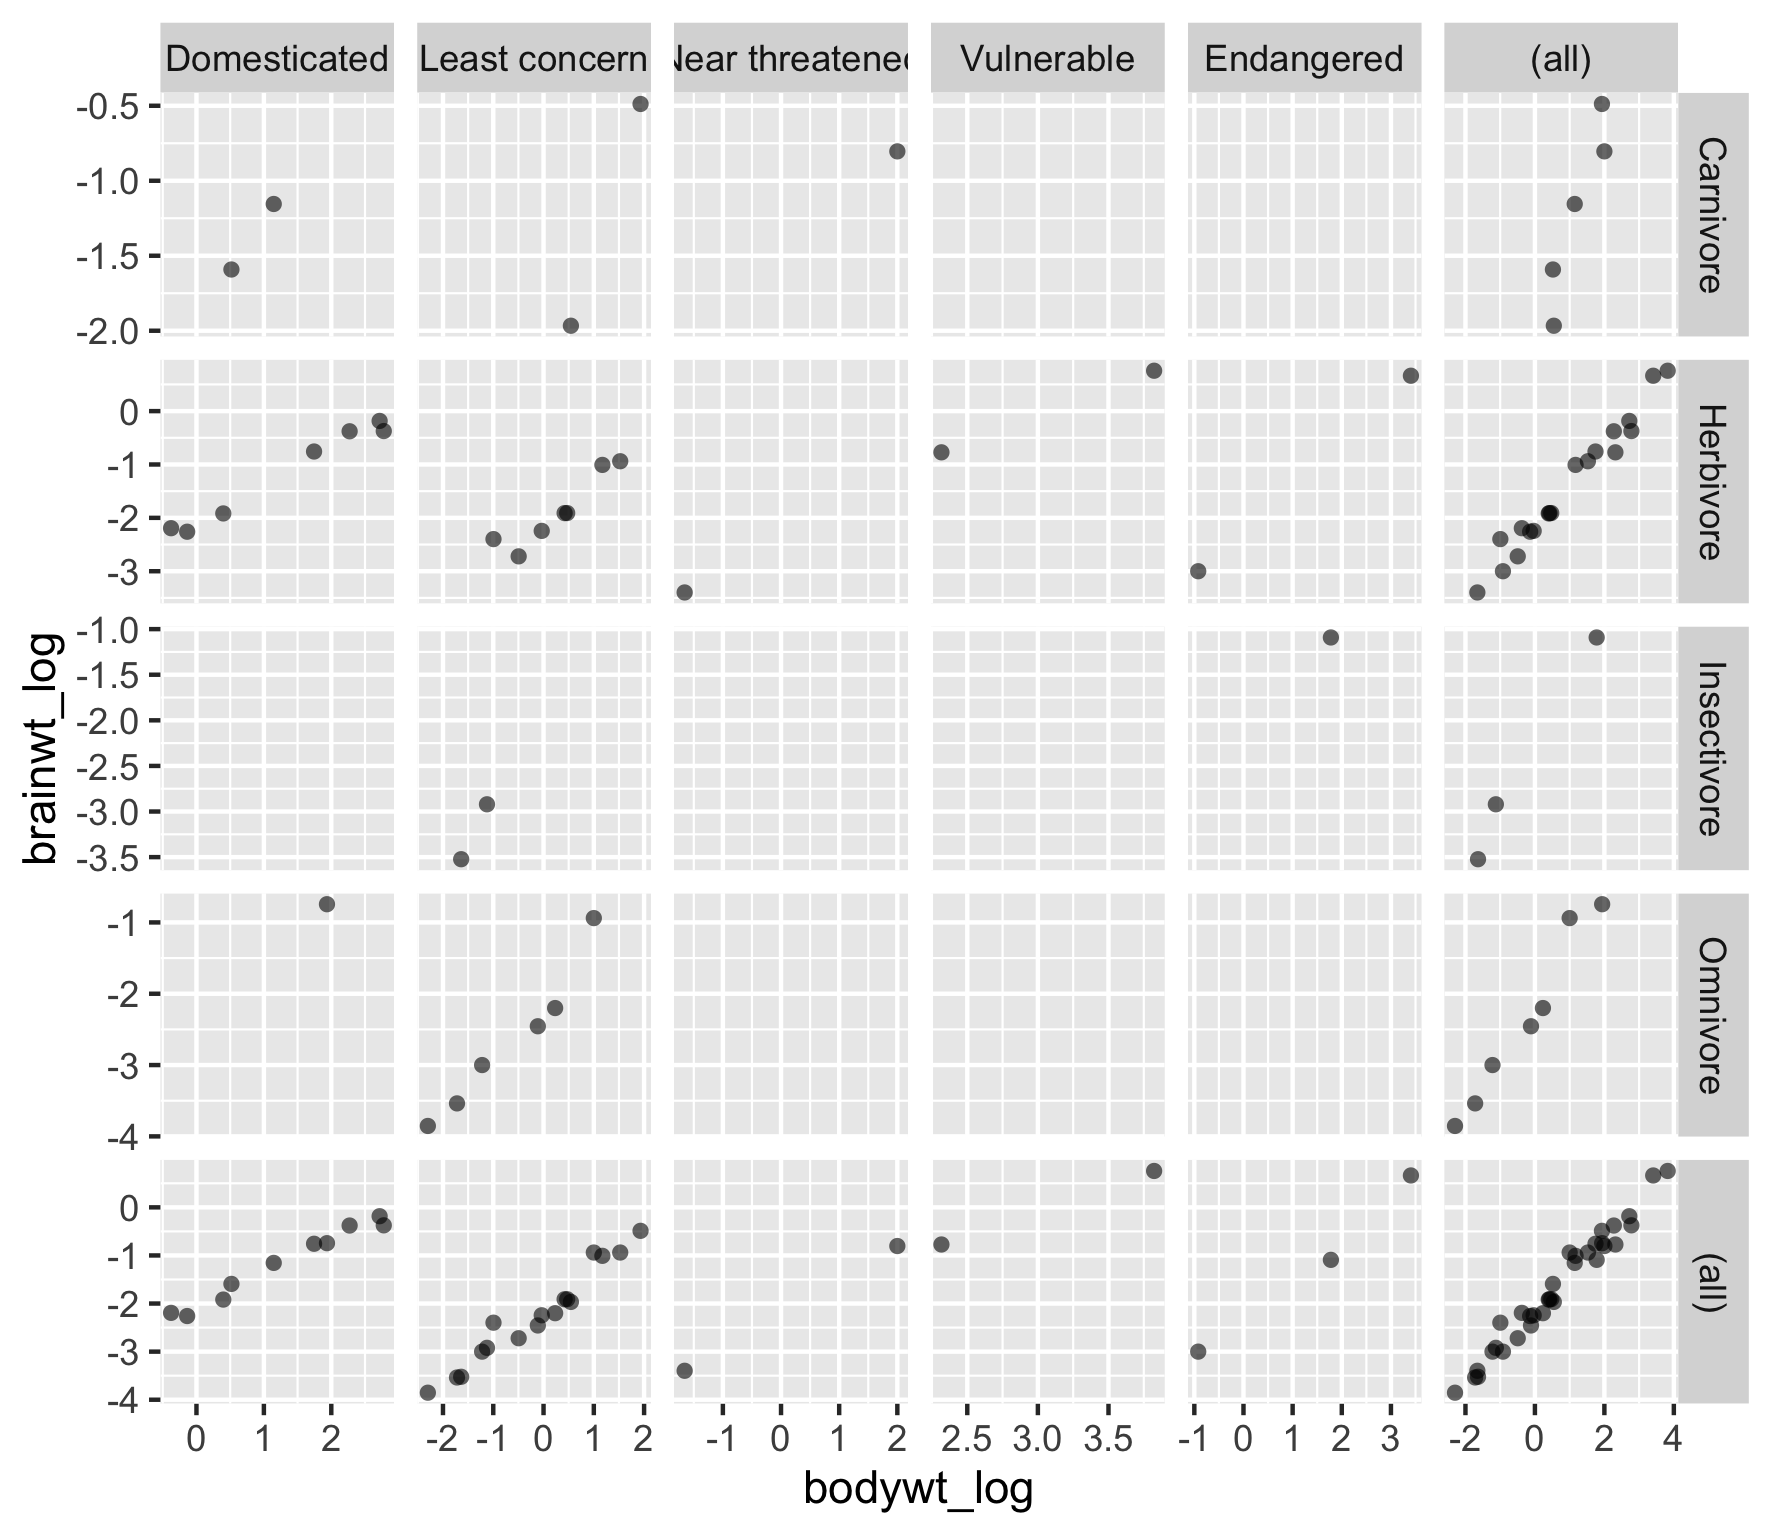
ggplot(msleep2, aes(bodywt_log, 
                    brainwt_log)) +
  geom_point(alpha = 0.6, shape = 16) +
  facet_grid(rows = vars(vore), 
             cols = vars(conservation),
             scales = "free",
             margins = TRUE) 

การสร้างภาพข้อมูลระดับกลางด้วย ggplot2

การใช้ margin plots

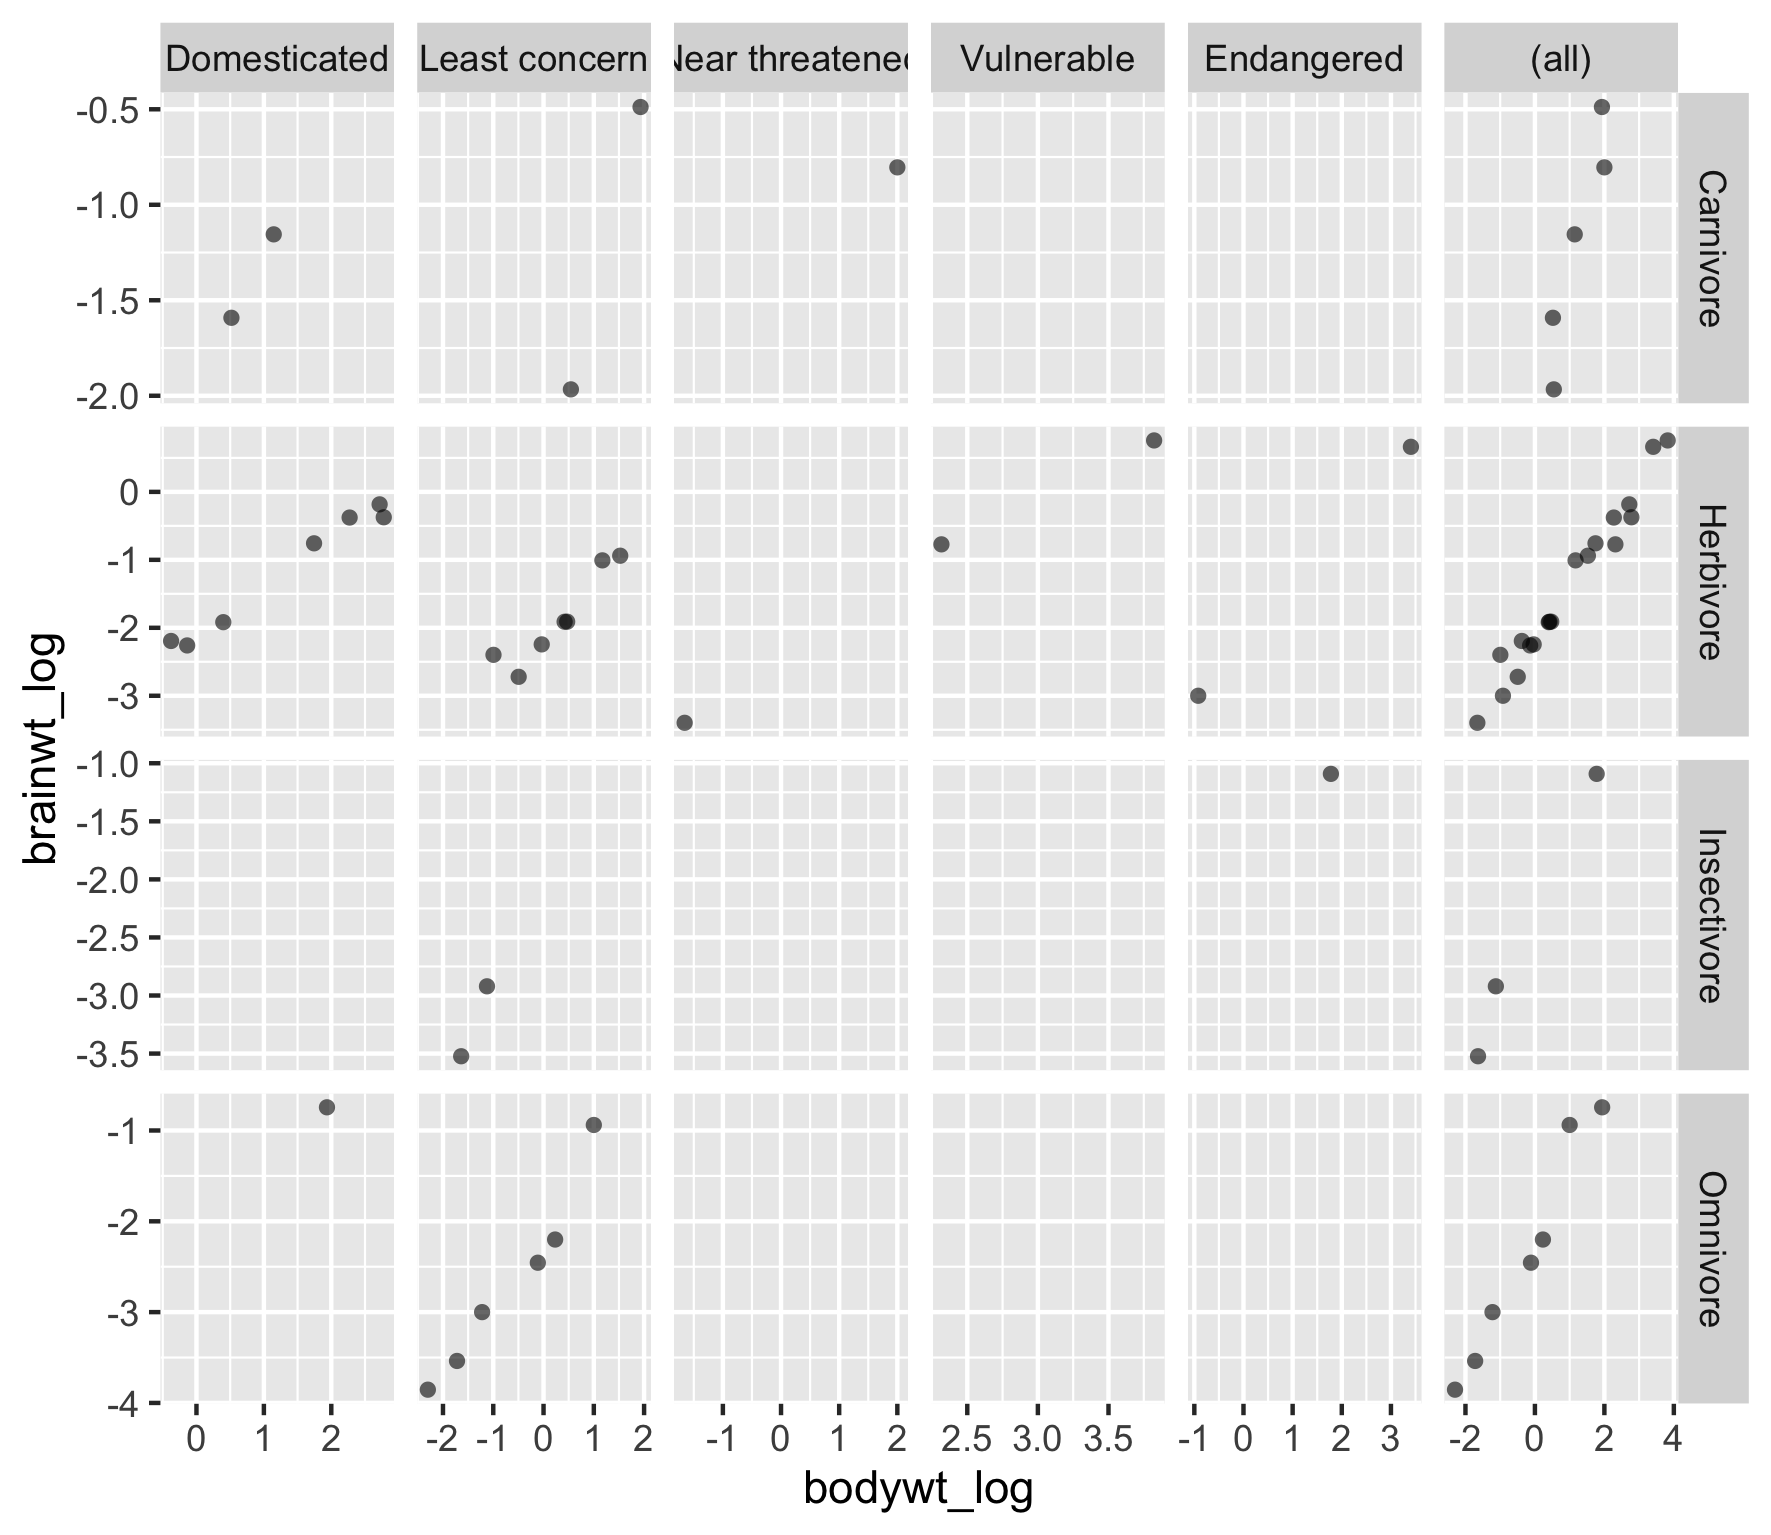
ggplot(msleep2, aes(bodywt_log, 
                    brainwt_log)) +
  geom_point(alpha = 0.6, shape = 16) +
  facet_grid(rows = vars(vore), 
             cols = vars(conservation),
             scales = "free",
             margins = "conservation")

การสร้างภาพข้อมูลระดับกลางด้วย ggplot2

มาฝึกกันเถอะ!

การสร้างภาพข้อมูลระดับกลางด้วย ggplot2

Preparing Video For Download...