เลเยอร์ facets

การสร้างภาพข้อมูลระดับกลางด้วย ggplot2

Rick Scavetta

Founder, Scavetta Academy
Facets

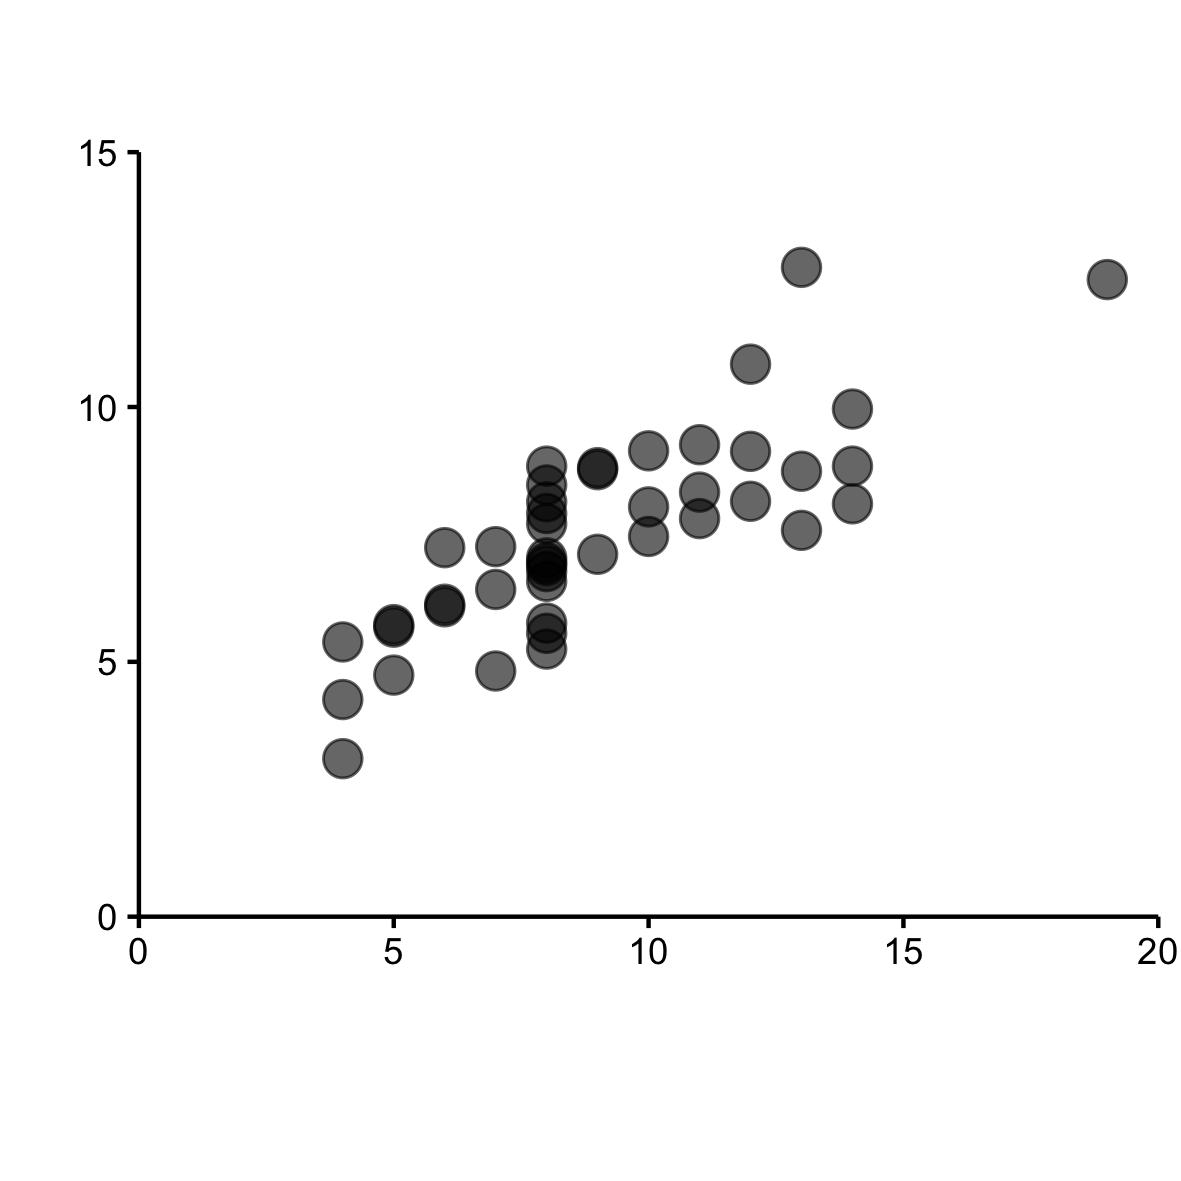
  • เรียบง่ายแต่มีประโยชน์
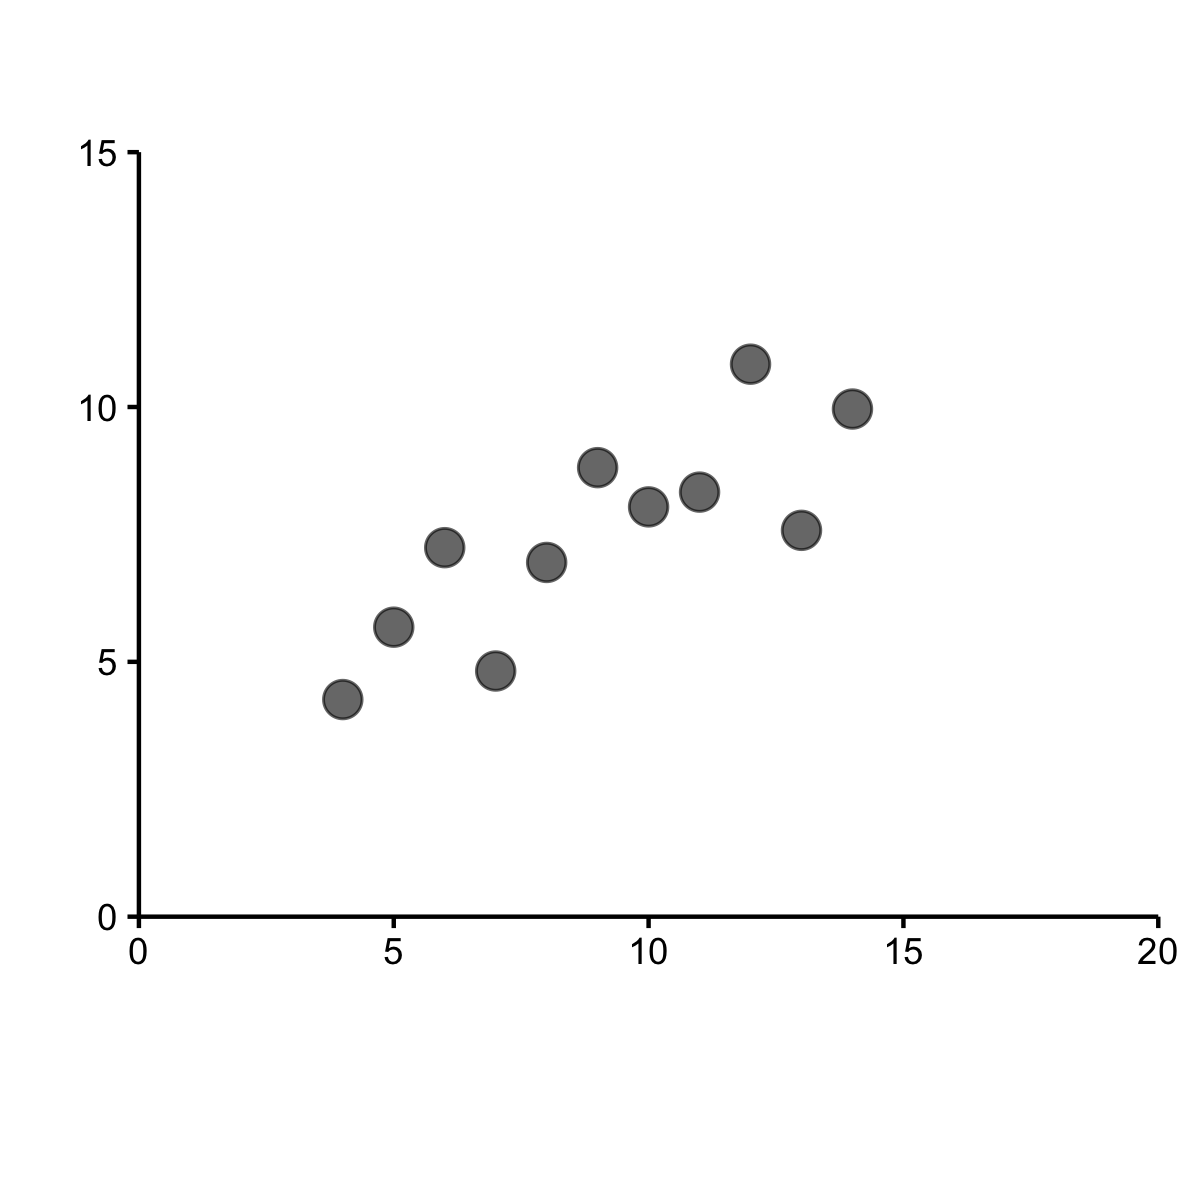
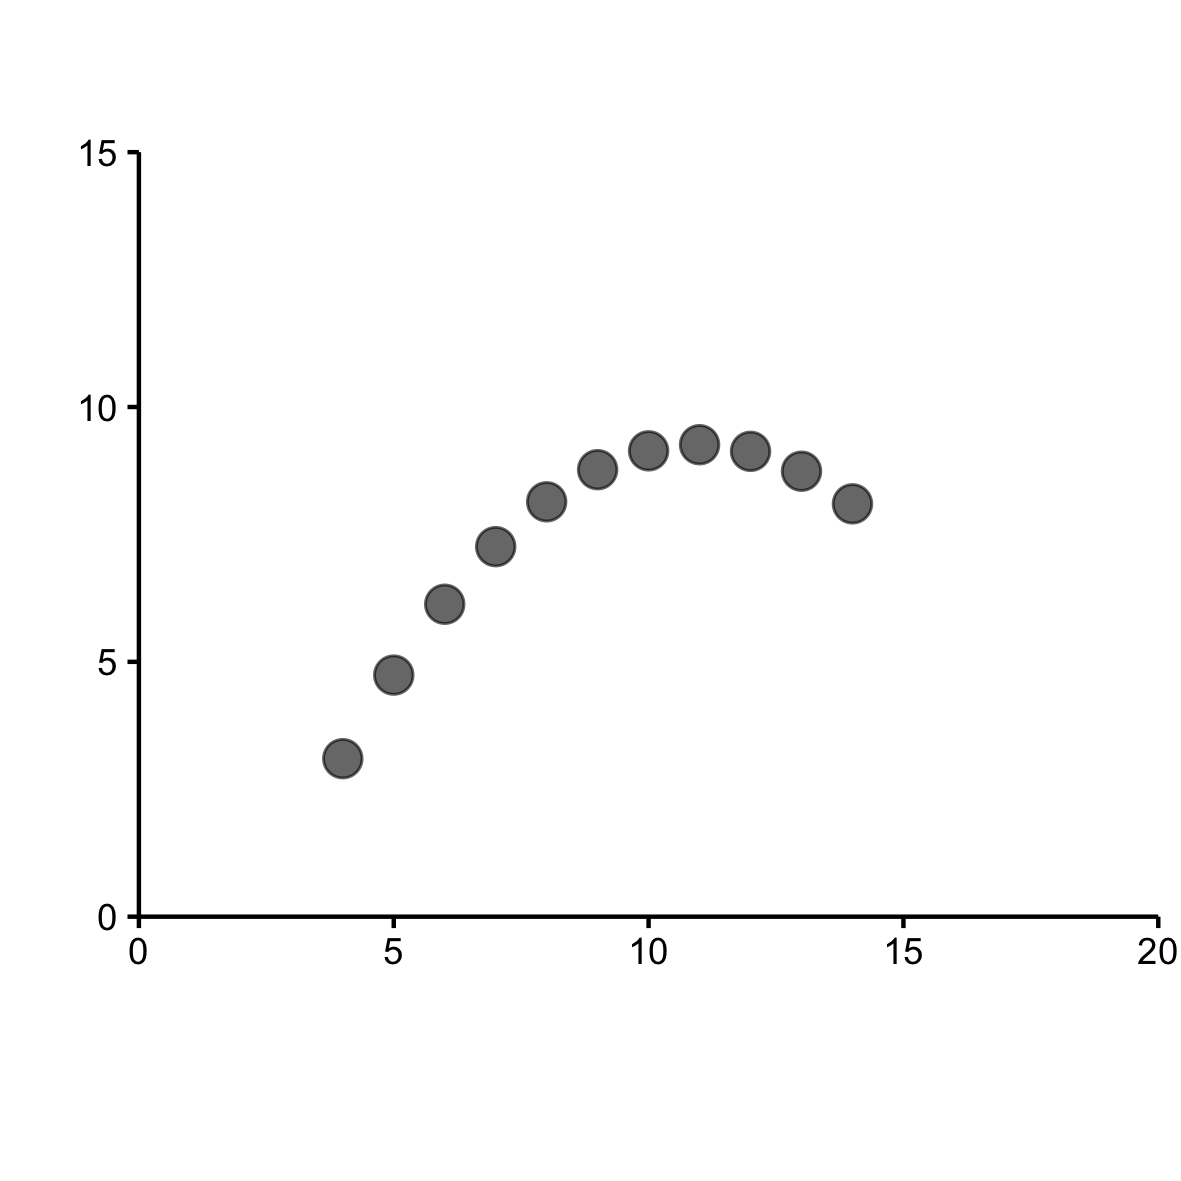
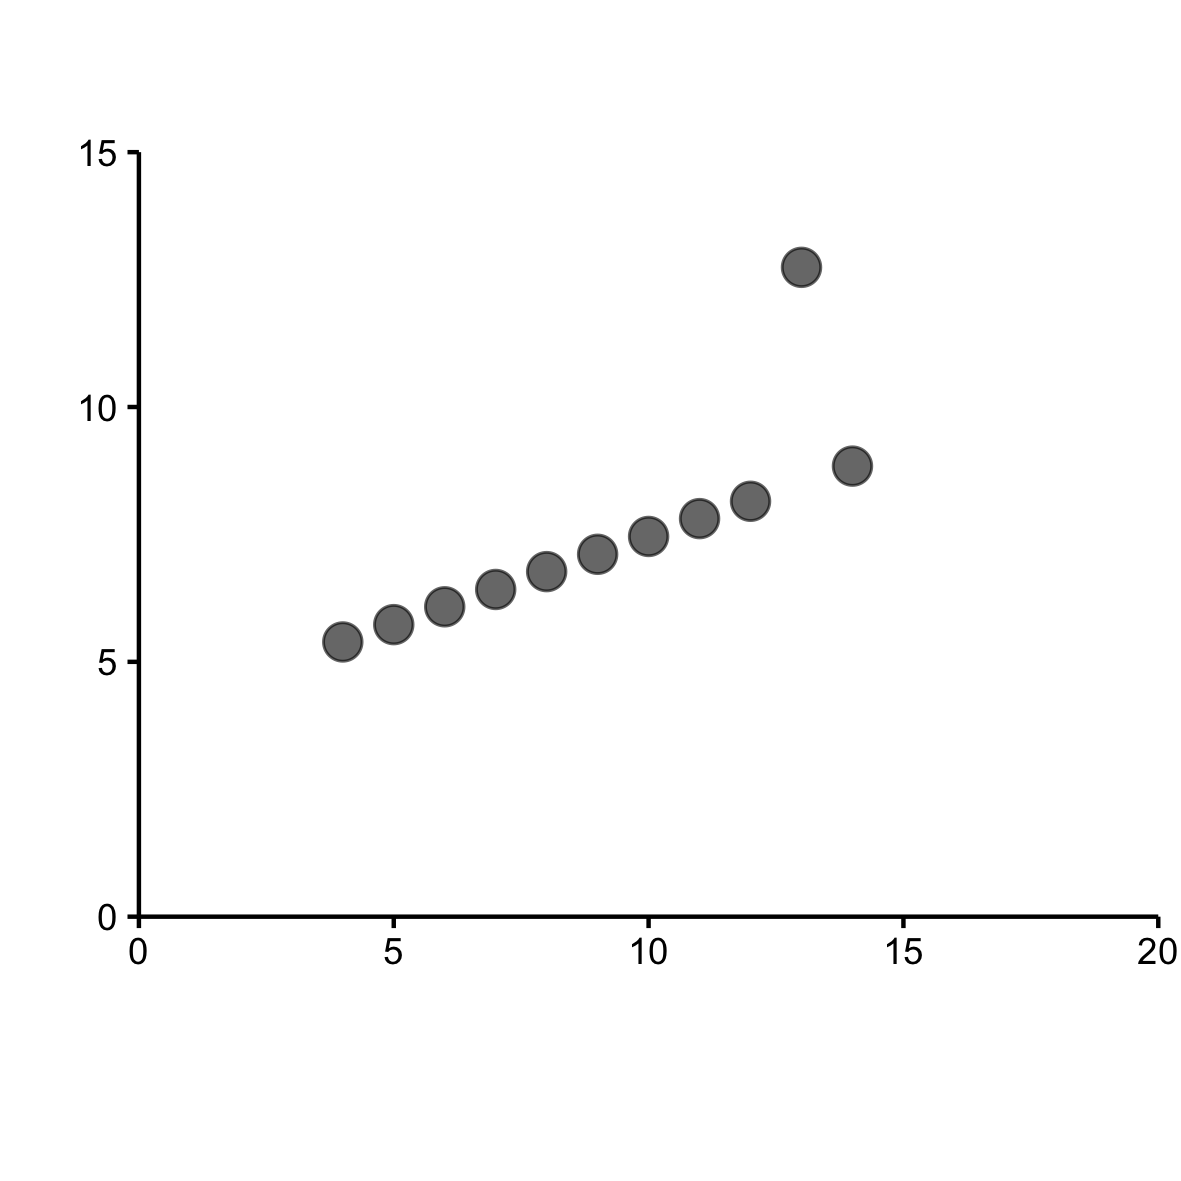
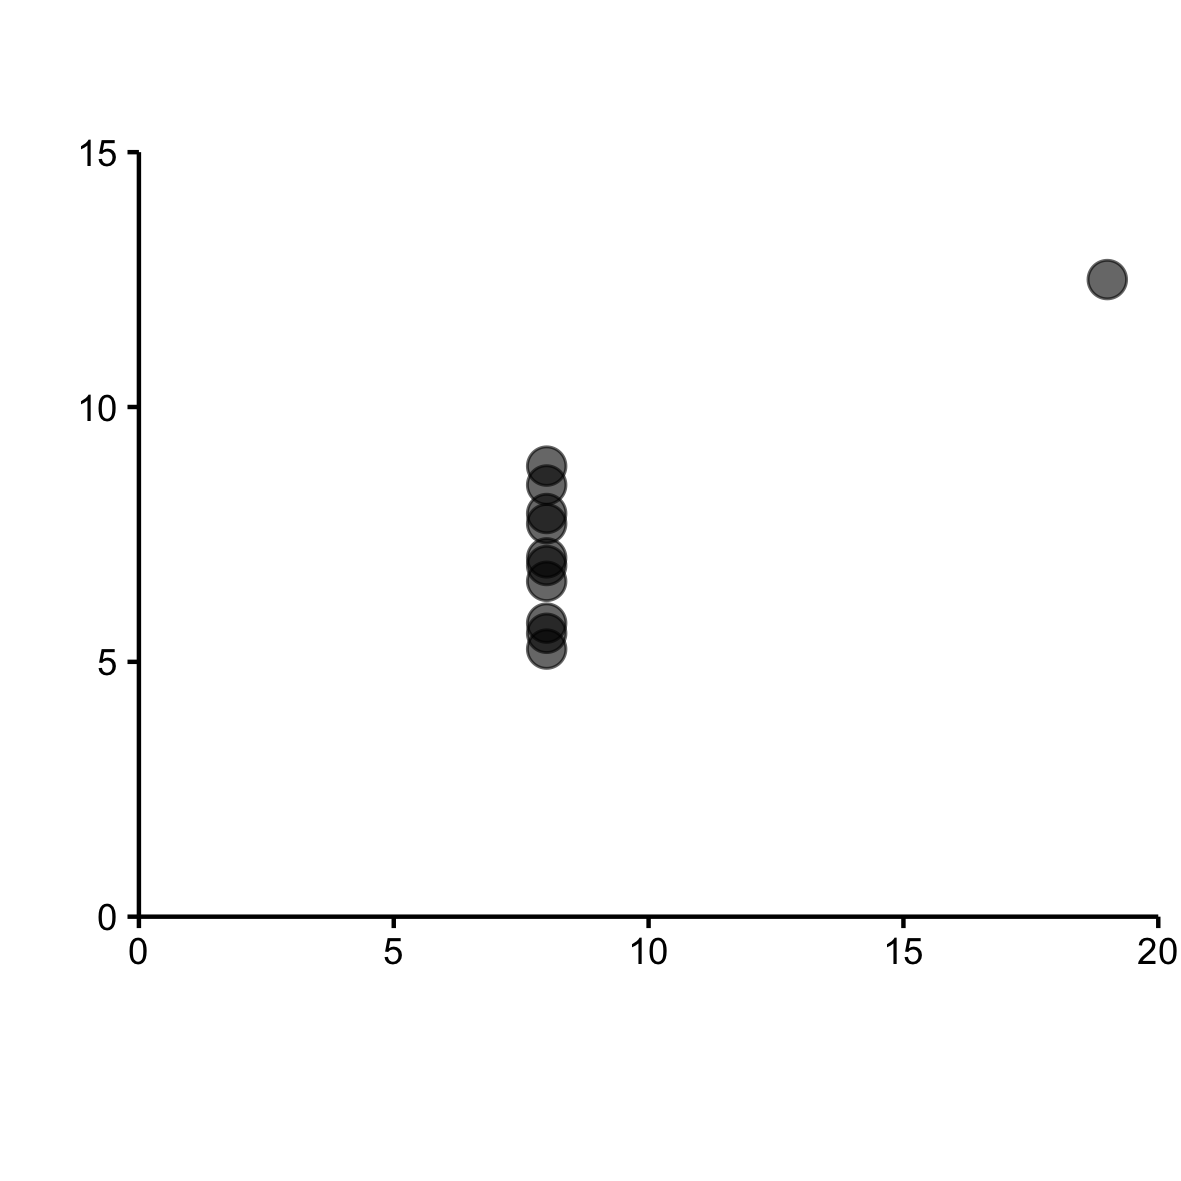
  • แนวคิด Small Multiples
    • เผยแพร่โดย Edward Tufte
    • Visualization of Quantitative Information, 1983
การสร้างภาพข้อมูลระดับกลางด้วย ggplot2

การสร้างภาพข้อมูลระดับกลางด้วย ggplot2

การสร้างภาพข้อมูลระดับกลางด้วย ggplot2

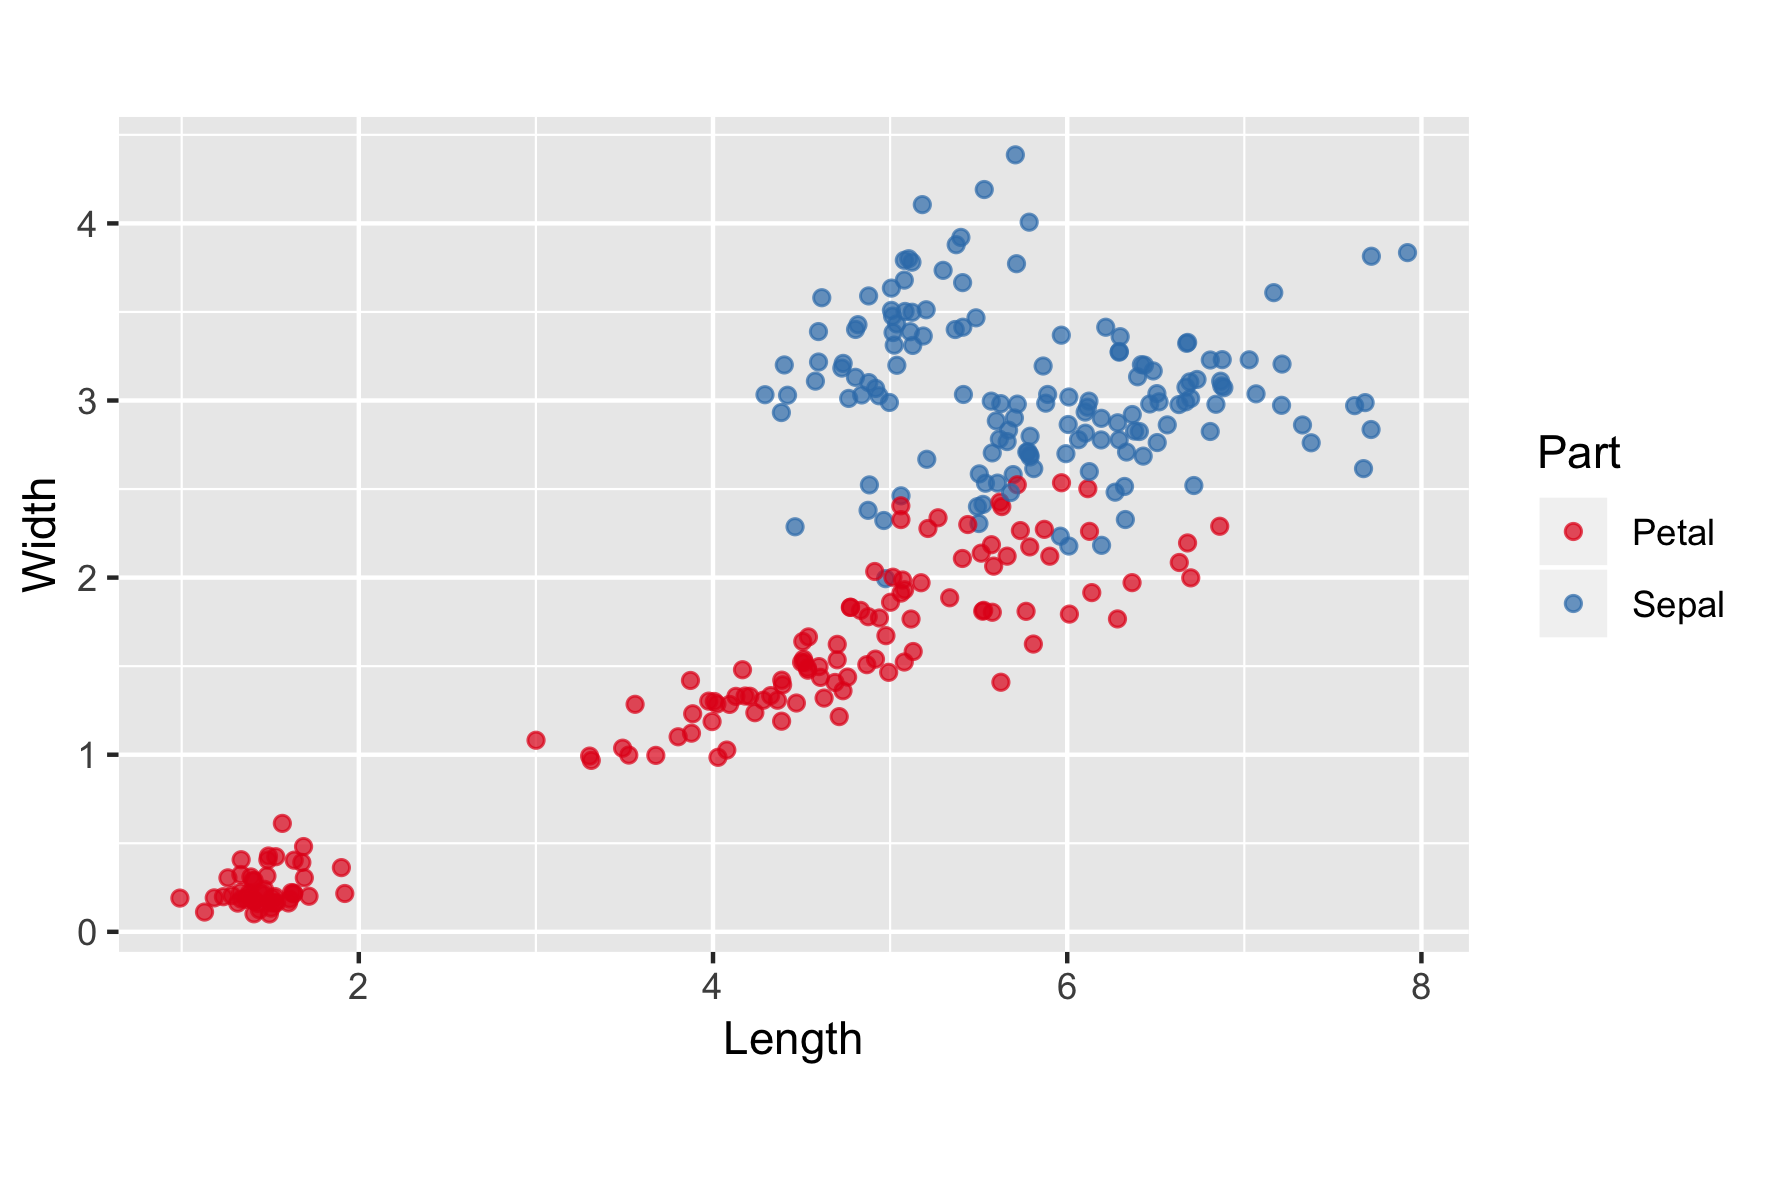
iris.wide

p <- ggplot(iris.wide, aes(x = Length, 
                           y = Width, 
                           ccolorol = Part)) +
  geom_jitter(alpha = 0.7) +
  scale_color_brewer(palette = "Set1") +
  coord_fixed()

p

การสร้างภาพข้อมูลระดับกลางด้วย ggplot2

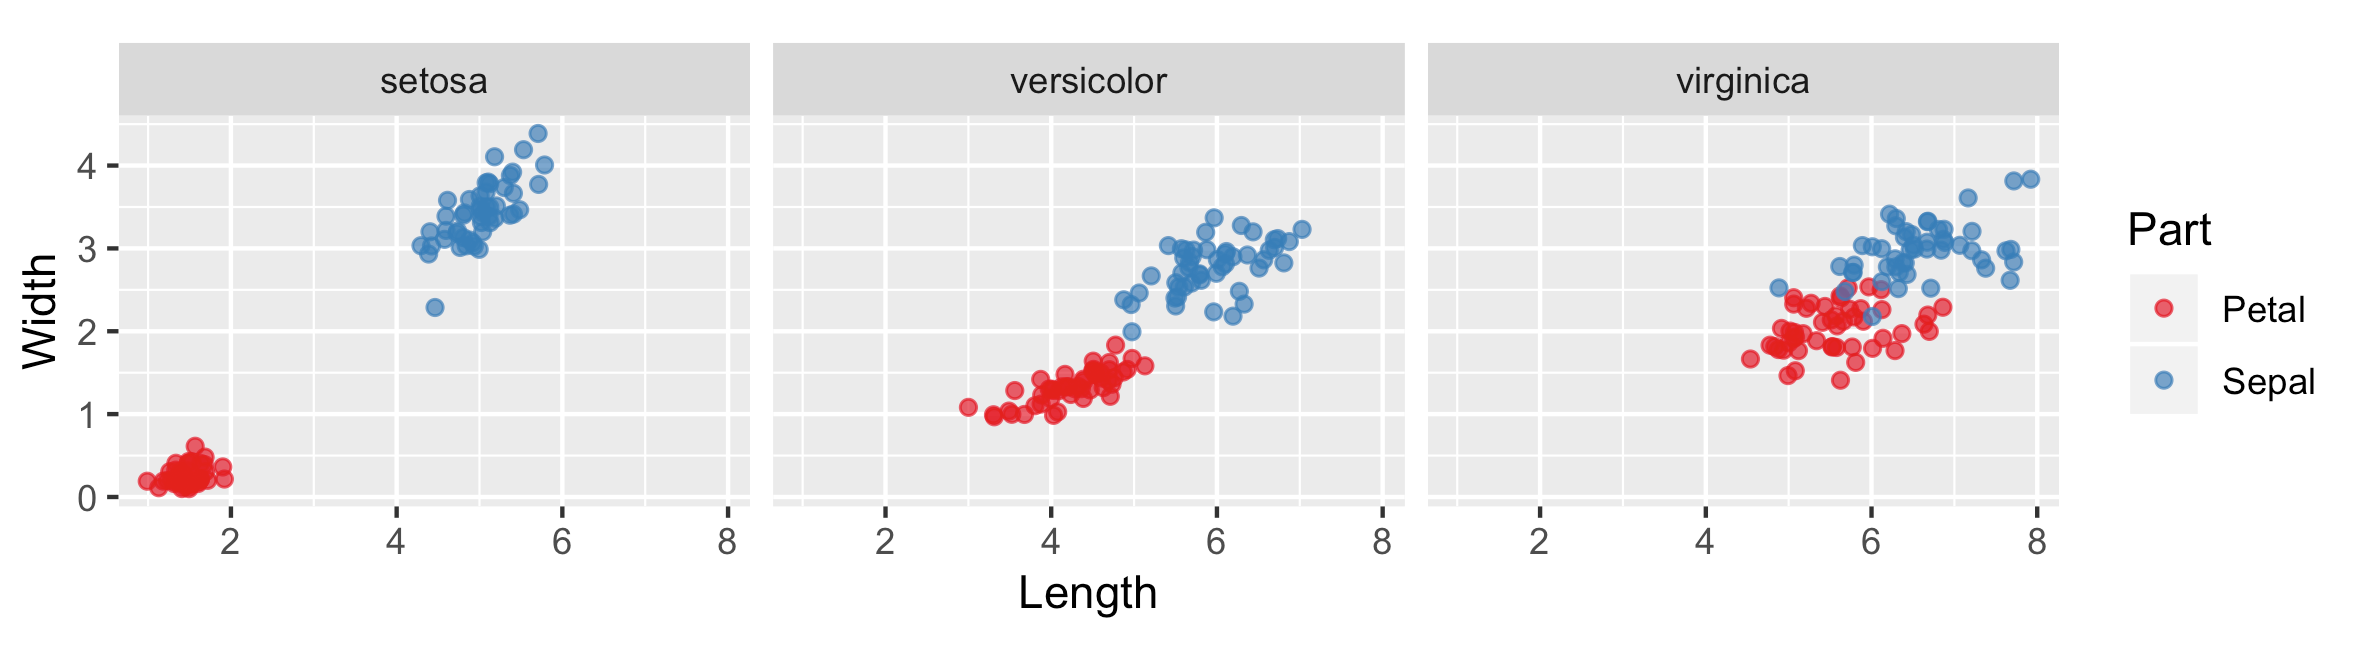
iris.wide & facet_grid()

p <- ggplot(iris.wide, aes(x = Length, y = Width, color = Part)) +
  geom_jitter(alpha = 0.7) +
  scale_color_brewer(palette = "Set1") +
  coord_fixed()
p + facet_grid(cols = vars(Species))
การสร้างภาพข้อมูลระดับกลางด้วย ggplot2

สัญกรณ์สูตร

p <- ggplot(iris.wide, aes(x = Length, y = Width, color = Part)) +
  geom_jitter(alpha = 0.7) +
  scale_color_brewer(palette = "Set1") +
  coord_fixed()
p + facet_grid(. ~ Species)

การสร้างภาพข้อมูลระดับกลางด้วย ggplot2

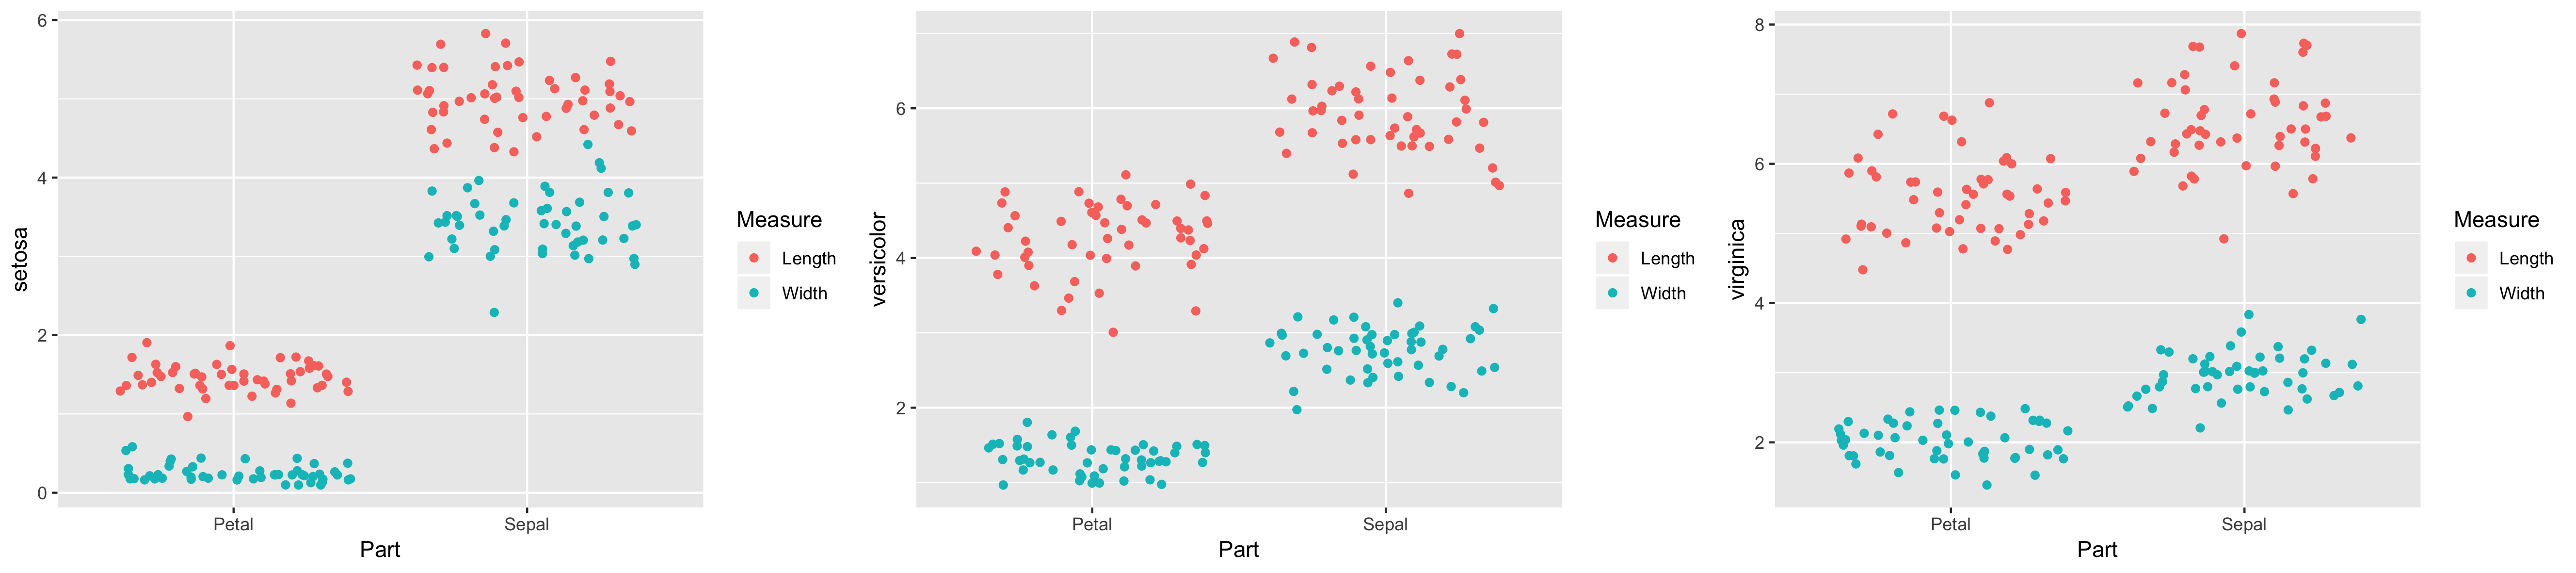
iris.wide2

ggplot(iris.wide2, aes(x = Part, y = setosa, color = Measure)) +
  geom_jitter()
ggplot(iris.wide2, aes(x = Part, y = versicolor, color = Measure)) +
  geom_jitter()  
ggplot(iris.wide2, aes(x = Part, y = virginica, color = Measure)) +
  geom_jitter()

การสร้างภาพข้อมูลระดับกลางด้วย ggplot2

iris.tidy

ggplot(iris.tidy, aes(x = Measure, y = Value, color = Part)) +
  geom_jitter() +
  facet_grid(cols = vars(Species))
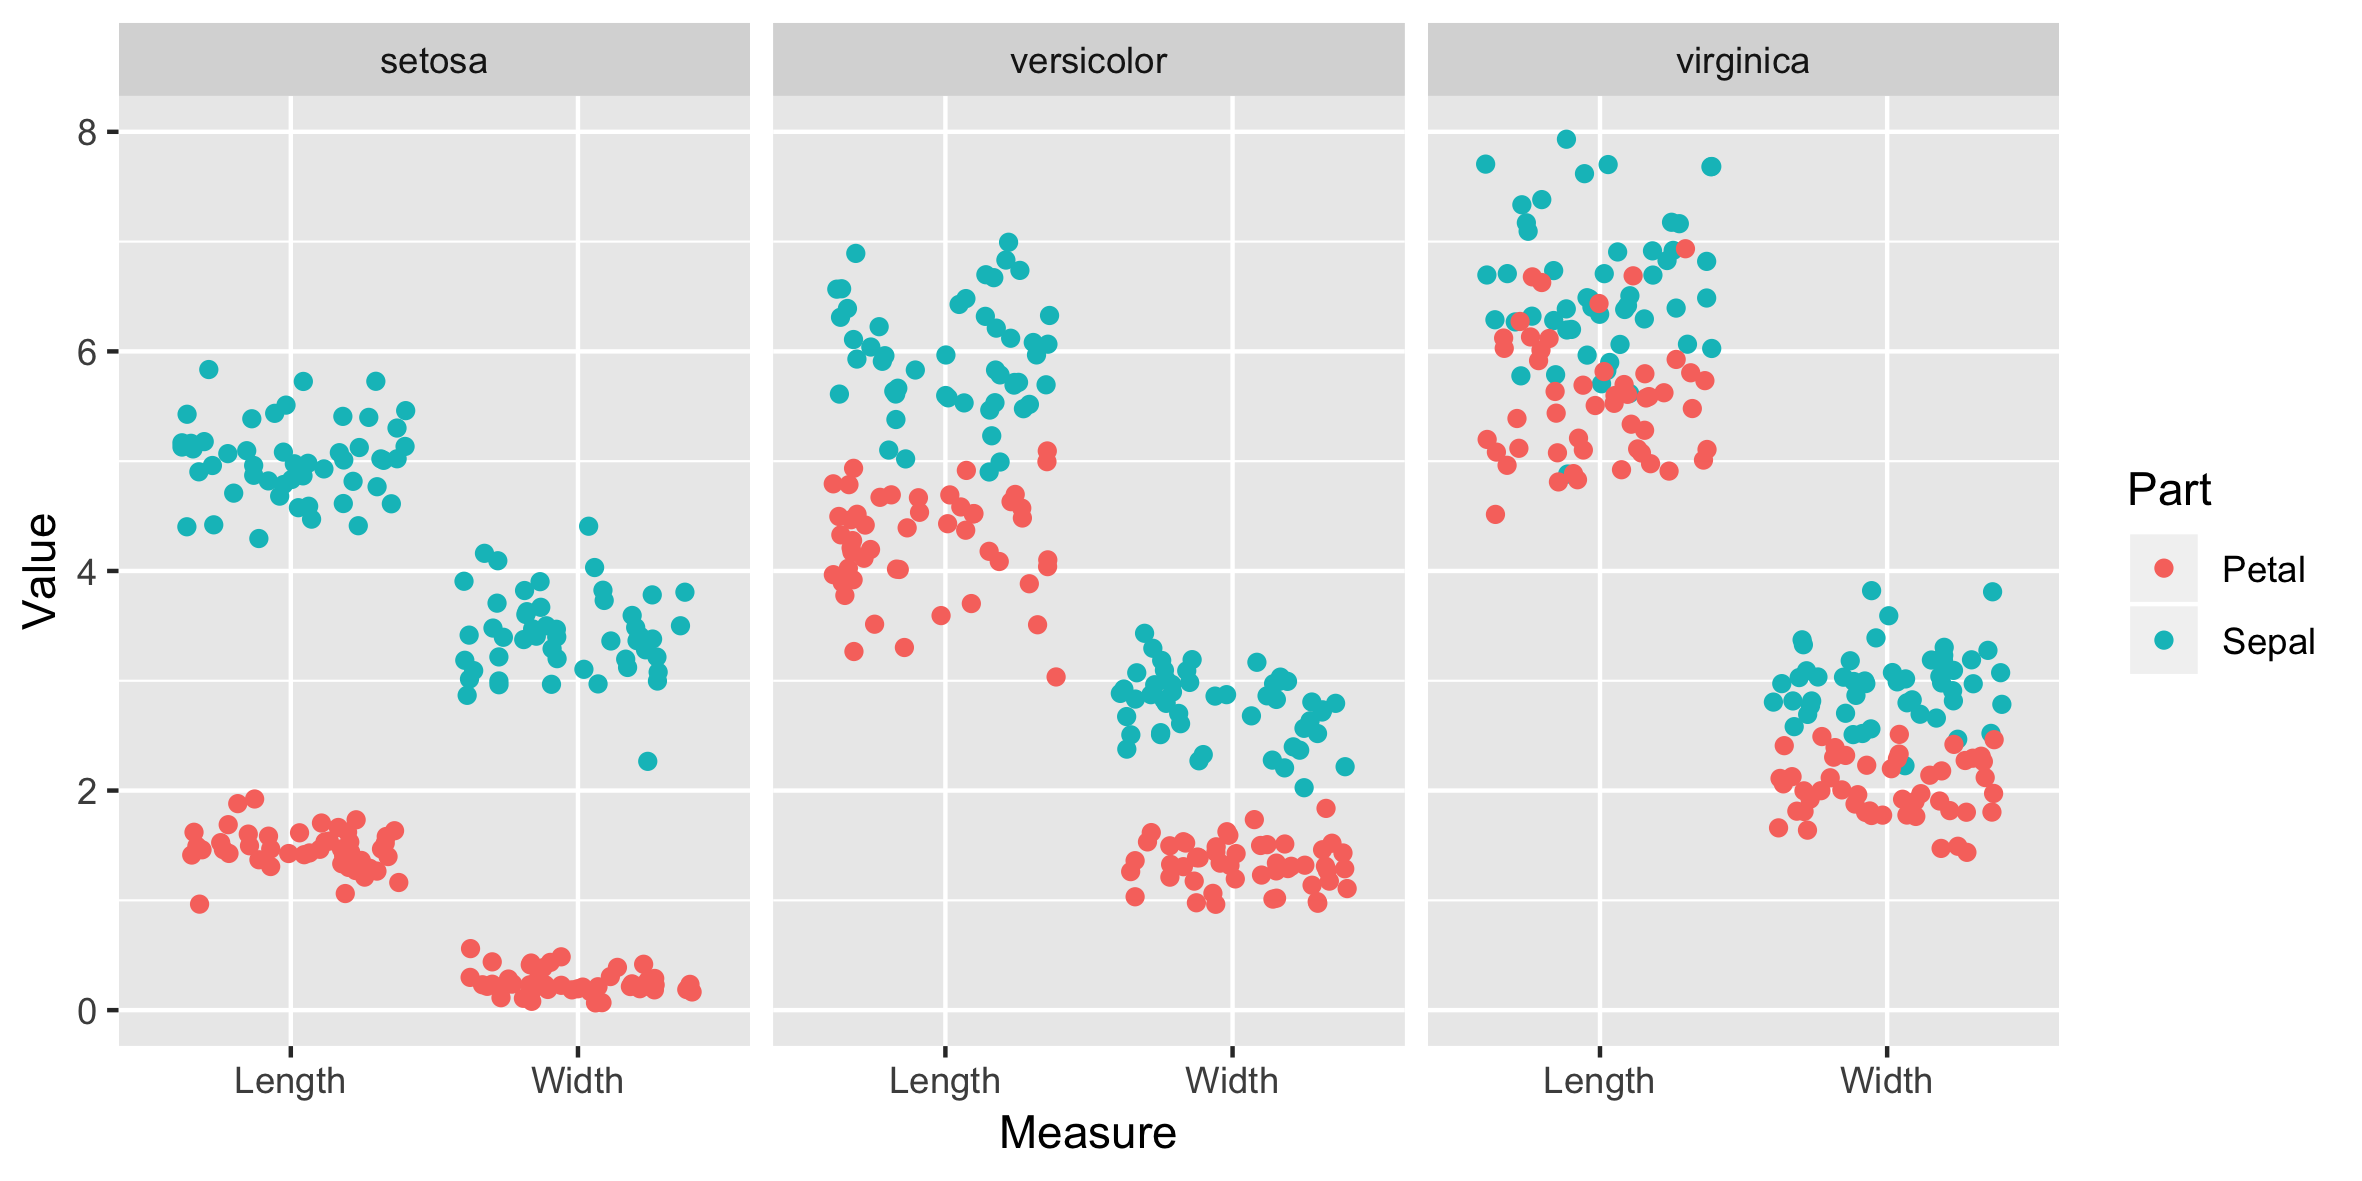
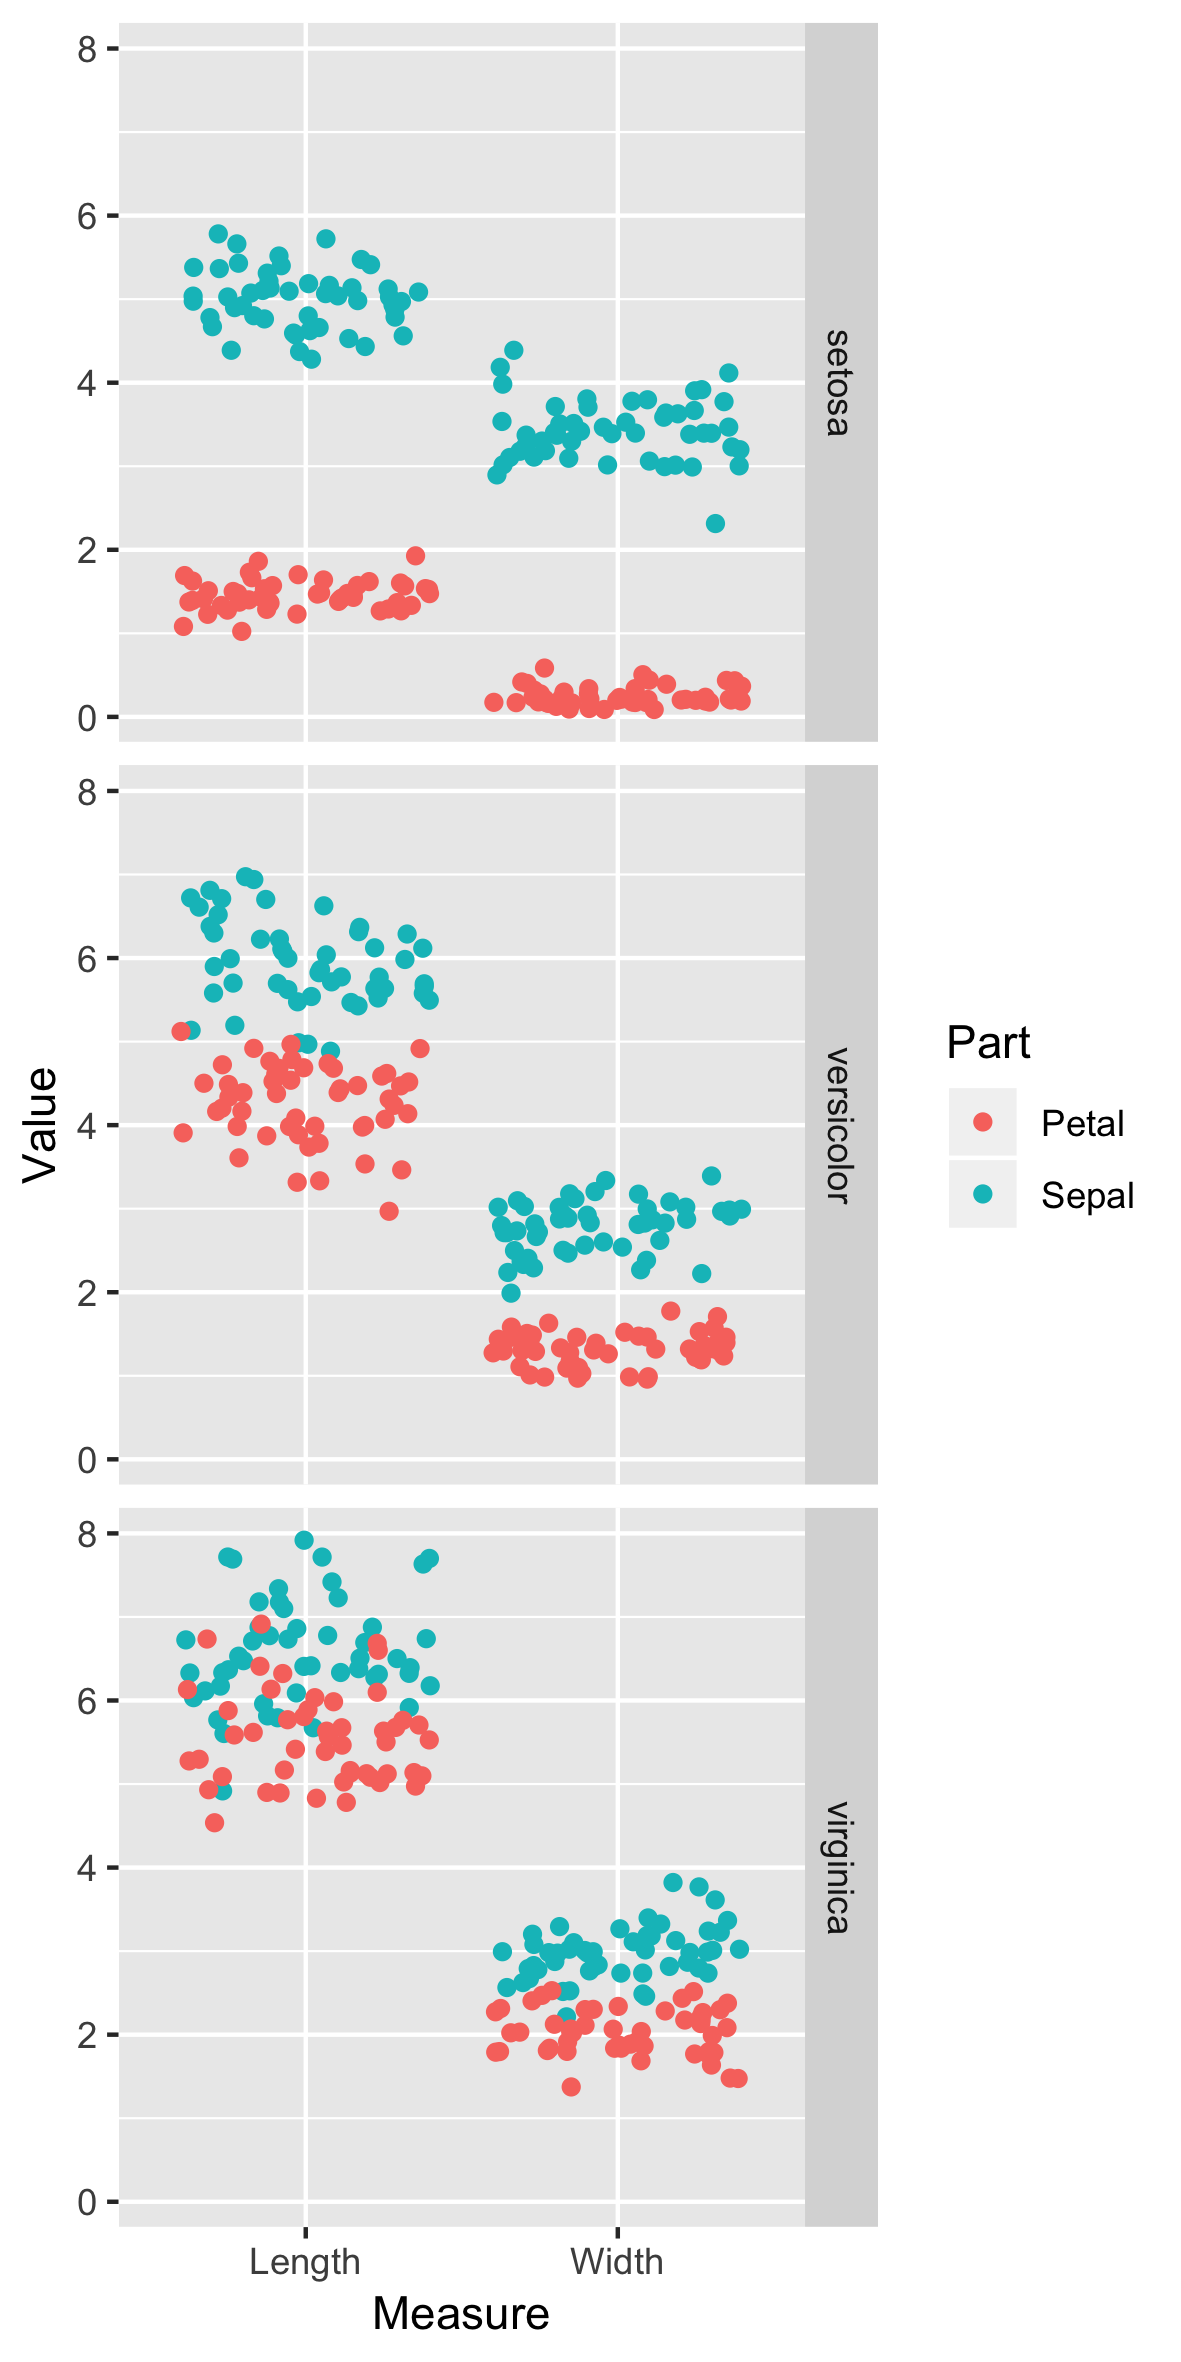
การสร้างภาพข้อมูลระดับกลางด้วย ggplot2

การทำ faceting บน iris.tidy แบบผิดวิธี:

ggplot(iris.tidy, aes(x = Measure, 
                      y = Value, 
                      color = Part)) +
  geom_jitter() +
  facet_grid(rows = vars(Species))

การสร้างภาพข้อมูลระดับกลางด้วย ggplot2

ตัวเลือกอื่น

  • แบ่งตามแถวและคอลัมน์
การสร้างภาพข้อมูลระดับกลางด้วย ggplot2

มาฝึกกันเถอะ!

การสร้างภาพข้อมูลระดับกลางด้วย ggplot2

Preparing Video For Download...