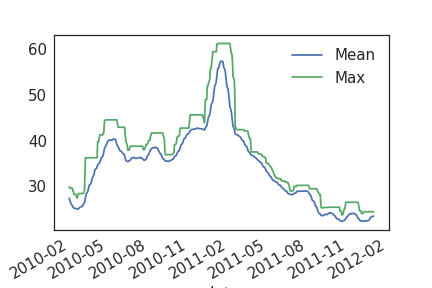
การสร้างฟีเจอร์ตามช่วงเวลา

Machine Learning สำหรับข้อมูล Time Series ใน Python

Chris Holdgraf

Fellow, Berkeley Institute for Data Science

การดึงฟีเจอร์ด้วย Windows
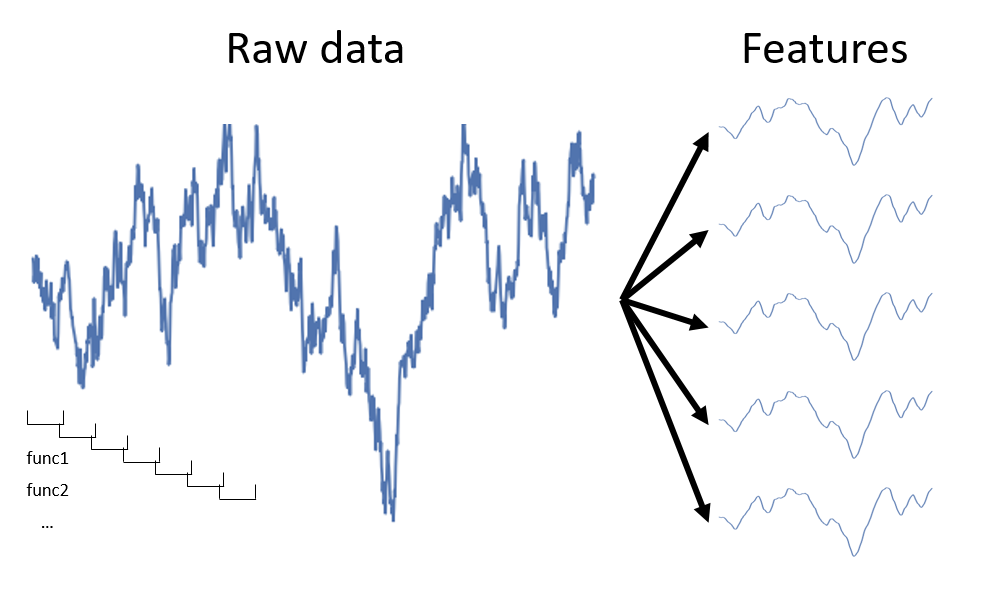
Machine Learning สำหรับข้อมูล Time Series ใน Python

การใช้ .aggregate เพื่อดึงฟีเจอร์

# Visualize the raw data
print(prices.head(3))
symbol            AIG        ABT
date                            
2010-01-04  29.889999  54.459951
2010-01-05  29.330000  54.019953
2010-01-06  29.139999  54.319953
# Calculate a rolling window, then extract two features
feats = prices.rolling(20).aggregate([np.std, np.max]).dropna()
print(feats.head(3))
                 AIG                  ABT           
                 std       amax       std       amax
date                                                
2010-02-01  2.051966  29.889999  0.868830  56.239949
2010-02-02  2.101032  29.629999  0.869197  56.239949
2010-02-03  2.157249  29.629999  0.852509  56.239949
Machine Learning สำหรับข้อมูล Time Series ใน Python

ตรวจสอบคุณสมบัติของฟีเจอร์ด้วย!

Machine Learning สำหรับข้อมูล Time Series ใน Python

การใช้ partial() ใน Python

# If we just take the mean, it returns a single value
a = np.array([[0, 1, 2], [0, 1, 2], [0, 1, 2]])
print(np.mean(a))
1.0
# We can use the partial function to initialize np.mean 
# with an axis parameter
from functools import partial
mean_over_first_axis = partial(np.mean, axis=0)

print(mean_over_first_axis(a))
[0. 1. 2.]
Machine Learning สำหรับข้อมูล Time Series ใน Python

เปอร์เซ็นไทล์ช่วยสรุปข้อมูลของคุณ

  • เปอร์เซ็นไทล์เป็นวิธีที่ดีในการสรุปข้อมูลแบบละเอียด (เมื่อเทียบกับการใช้ np.mean)
  • เปอร์เซ็นไทล์ที่ N ของชุดข้อมูลใดๆ คือค่าที่มีข้อมูล N% อยู่ต่ำกว่า และอีก 100-N% อยู่สูงกว่า
print(np.percentile(np.linspace(0, 200), q=20))
40.0
Machine Learning สำหรับข้อมูล Time Series ใน Python

การรวม np.percentile() กับ partial functions เพื่อคำนวณเปอร์เซ็นไทล์หลายค่า

data = np.linspace(0, 100)

# Create a list of functions using a list comprehension
percentile_funcs = [partial(np.percentile, q=ii) for ii in [20, 40, 60]]

# Calculate the output of each function in the same way
percentiles = [i_func(data) for i_func in percentile_funcs]
print(percentiles)
[20.0, 40.00000000000001, 60.0]
# Calculate multiple percentiles of a rolling window
data.rolling(20).aggregate(percentiles)
Machine Learning สำหรับข้อมูล Time Series ใน Python

การคำนวณฟีเจอร์เชิง "วันที่"

  • ที่ผ่านมาเราเน้นการคำนวณฟีเจอร์เชิงสถิติ ได้แก่ ฟีเจอร์ที่สะท้อนคุณสมบัติทางสถิติของข้อมูล เช่น "ค่าเฉลี่ย" "ส่วนเบี่ยงเบนมาตรฐาน" เป็นต้น
  • อย่าลืมว่าข้อมูล timeseries มักมีฟีเจอร์เชิง "มนุษย์" ด้วย เช่น วันในสัปดาห์ วันหยุด ฯลฯ
  • ฟีเจอร์เหล่านี้มีประโยชน์มากเมื่อใช้กับข้อมูล timeseries ที่ครอบคลุมหลายปี เช่น ราคาหุ้นตามช่วงเวลา
Machine Learning สำหรับข้อมูล Time Series ใน Python

ฟีเจอร์ datetime ด้วย Pandas

# Ensure our index is datetime
prices.index = pd.to_datetime(prices.index)

# Extract datetime features
day_of_week_num = prices.index.weekday
print(day_of_week_num[:10])
Index([0 1 2 3 4 0 1 2 3 4], dtype='object')
day_of_week = prices.index.day_name()
print(day_of_week[:10])
Index(['Monday' 'Tuesday' 'Wednesday' 'Thursday' 'Friday' 'Monday' 'Tuesday'
 'Wednesday' 'Thursday' 'Friday'], dtype='object')
Machine Learning สำหรับข้อมูล Time Series ใน Python

มาฝึกกันเถอะ!

Machine Learning สำหรับข้อมูล Time Series ใน Python

Preparing Video For Download...