การทำความสะอาดและปรับปรุงข้อมูล

Machine Learning สำหรับข้อมูล Time Series ใน Python

Chris Holdgraf

Fellow, Berkeley Institute for Data Science

ข้อมูลที่ไม่เป็นระเบียบ

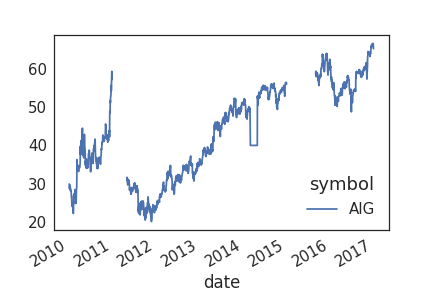
  • ข้อมูลในโลกจริงมักไม่เป็นระเบียบ
  • ปัญหาที่พบบ่อยที่สุดสองอย่างคือ ข้อมูลที่หายไป และ ค่าผิดปกติ (outliers)
  • มักเกิดจากความผิดพลาดของมนุษย์ เซ็นเซอร์ขัดข้อง หรือฐานข้อมูลล้มเหลว
  • การแสดงผลข้อมูลดิบช่วยให้ตรวจพบปัญหาเหล่านี้ได้ง่ายขึ้น
Machine Learning สำหรับข้อมูล Time Series ใน Python

ข้อมูลที่ไม่เป็นระเบียบมีลักษณะอย่างไร
Machine Learning สำหรับข้อมูล Time Series ใน Python

Interpolation: ใช้เวลาเติมข้อมูลที่หายไป

  • วิธีทั่วไปในการจัดการกับข้อมูลที่หายไปคือการ ประมาณค่า (interpolate)
  • สำหรับข้อมูลอนุกรมเวลา สามารถใช้เวลาช่วยในการประมาณค่าได้
  • การประมาณค่า คือการใช้ค่า ที่ทราบ ทั้งสองฝั่งของช่องว่างในข้อมูลเพื่อสรุปค่าที่หายไป
Machine Learning สำหรับข้อมูล Time Series ใน Python

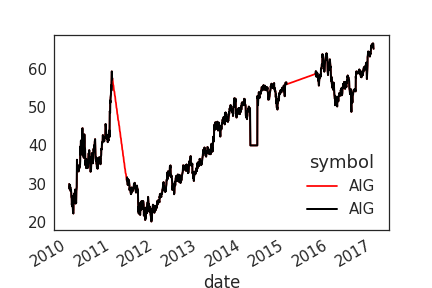
Interpolation ใน Pandas

# Return a boolean that notes where missing values are
missing = prices.isna()

# Interpolate linearly within missing windows
prices_interp = prices.interpolate('linear')

# Plot the interpolated data in red and the data w/ missing values in black
ax = prices_interp.plot(c='r')
prices.plot(c='k', ax=ax, lw=2)
Machine Learning สำหรับข้อมูล Time Series ใน Python

แสดงผลข้อมูลหลังการประมาณค่า

Machine Learning สำหรับข้อมูล Time Series ใน Python

ใช้ Rolling Window แปลงข้อมูล

  • การใช้ rolling window อีกวิธีหนึ่งคือการแปลงข้อมูล
  • เราเคยทำสิ่งนี้แล้วครั้งหนึ่ง เพื่อ ทำให้ข้อมูลเรียบขึ้น
  • นอกจากนี้ยังใช้ทำการแปลงข้อมูลที่ซับซ้อนมากขึ้นได้อีกด้วย
Machine Learning สำหรับข้อมูล Time Series ใน Python

แปลงข้อมูลเพื่อปรับมาตรฐานความแปรปรวน

  • การแปลงข้อมูลที่นิยมใช้คือการปรับมาตรฐานค่าเฉลี่ยและความแปรปรวนตามเวลา ซึ่งทำได้หลายวิธี
  • ที่นี่จะแสดงวิธีแปลงชุดข้อมูลให้แต่ละจุดแทน % การเปลี่ยนแปลงเทียบกับ window ก่อนหน้า
  • วิธีนี้ช่วยให้เปรียบเทียบจุดเวลาต่าง ๆ ได้ง่ายขึ้น เมื่อค่าสัมบูรณ์ของข้อมูลเปลี่ยนแปลงมาก
Machine Learning สำหรับข้อมูล Time Series ใน Python

แปลงข้อมูลเป็น Percent Change ด้วย Pandas

def percent_change(values):
    """Calculates the % change between the last value 
    and the mean of previous values"""
    # Separate the last value and all previous values into variables
    previous_values = values[:-1]
    last_value = values[-1]

    # Calculate the % difference between the last value 
    # and the mean of earlier values
    percent_change = (last_value - np.mean(previous_values)) \
    / np.mean(previous_values)
    return percent_change
Machine Learning สำหรับข้อมูล Time Series ใน Python

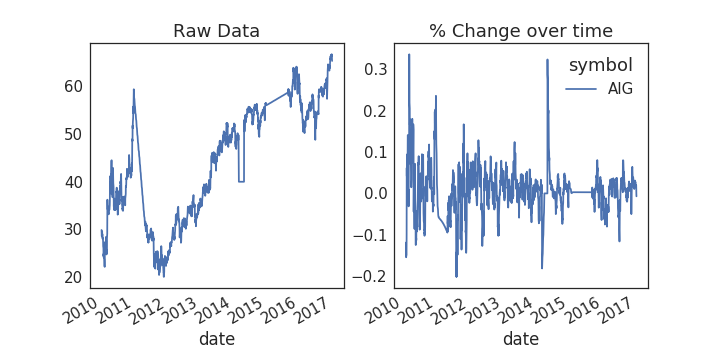
นำไปใช้กับข้อมูลของเรา

# Plot the raw data
fig, axs = plt.subplots(1, 2, figsize=(10, 5))
ax = prices.plot(ax=axs[0])

# Calculate % change and plot
ax = prices.rolling(window=20).aggregate(percent_change).plot(ax=axs[1])
ax.legend_.set_visible(False)
Machine Learning สำหรับข้อมูล Time Series ใน Python

การค้นหาค่าผิดปกติในข้อมูล

  • ค่าผิดปกติ (outliers) คือจุดข้อมูลที่แตกต่างจากชุดข้อมูลอย่างมีนัยสำคัญทางสถิติ
  • อาจส่งผลเสียต่อความสามารถในการทำนายของโมเดล ทำให้โมเดลเบี่ยงเบนจากค่า "จริง"
  • วิธีแก้คือ ลบ หรือ แทนที่ ค่าผิดปกติด้วยค่าที่เหมาะสมกว่า

ระวังให้ดี ก่อนดำเนินการนี้ เพราะมักยากที่จะแยกแยะระหว่างค่าสุดขีดที่ถูกต้องกับค่าผิดปกติจริง ๆ

Machine Learning สำหรับข้อมูล Time Series ใน Python

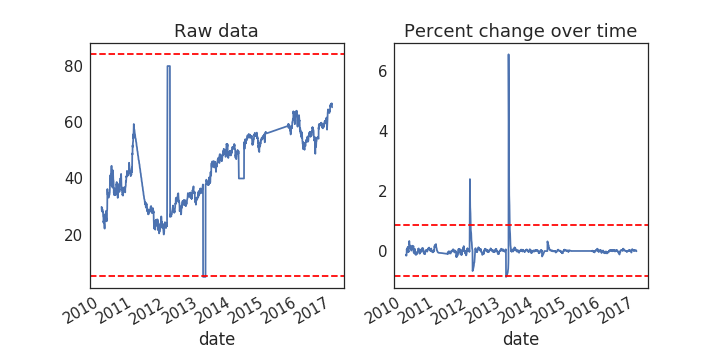
พล็อต Threshold บนข้อมูลของเรา

fig, axs = plt.subplots(1, 2, figsize=(10, 5))
for data, ax in zip([prices, prices_perc_change], axs):
    # Calculate the mean / standard deviation for the data
    this_mean = data.mean()
    this_std = data.std()

    # Plot the data, with a window that is 3 standard deviations 
    # around the mean
    data.plot(ax=ax)
    ax.axhline(this_mean + this_std * 3, ls='--', c='r')
    ax.axhline(this_mean - this_std * 3, ls='--', c='r')
Machine Learning สำหรับข้อมูล Time Series ใน Python

แสดงผล Threshold ของค่าผิดปกติ

Machine Learning สำหรับข้อมูล Time Series ใน Python

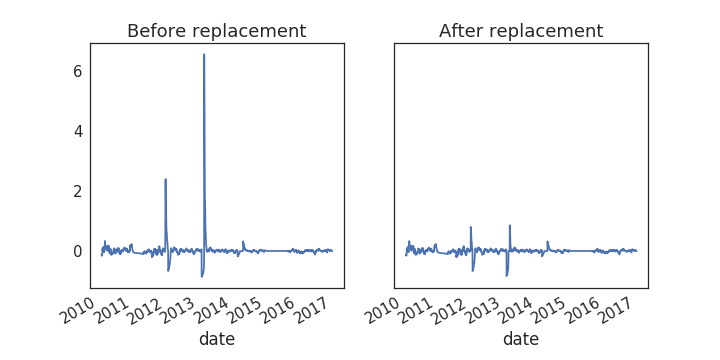
แทนที่ค่าผิดปกติโดยใช้ Threshold

# Center the data so the mean is 0
prices_outlier_centered = prices_outlier_perc - prices_outlier_perc.mean()

# Calculate standard deviation
std = prices_outlier_perc.std()

# Use the absolute value of each datapoint 
# to make it easier to find outliers
outliers = np.abs(prices_outlier_centered) > (std * 3)

# Replace outliers with the median value
# We'll use np.nanmean since there may be nans around the outliers
prices_outlier_fixed = prices_outlier_centered.copy()
prices_outlier_fixed[outliers] = np.nanmedian(prices_outlier_fixed)

Machine Learning สำหรับข้อมูล Time Series ใน Python

แสดงผลลัพธ์

fig, axs = plt.subplots(1, 2, figsize=(10, 5))
prices_outlier_centered.plot(ax=axs[0])
prices_outlier_fixed.plot(ax=axs[1])
Machine Learning สำหรับข้อมูล Time Series ใน Python

มาฝึกกันเถอะ!

Machine Learning สำหรับข้อมูล Time Series ใน Python

Preparing Video For Download...