ความนิ่งสถิตและเสถียรภาพ

Machine Learning สำหรับข้อมูล Time Series ใน Python

Chris Holdgraf

Fellow, Berkeley Institute for Data Science
ความนิ่งสถิต

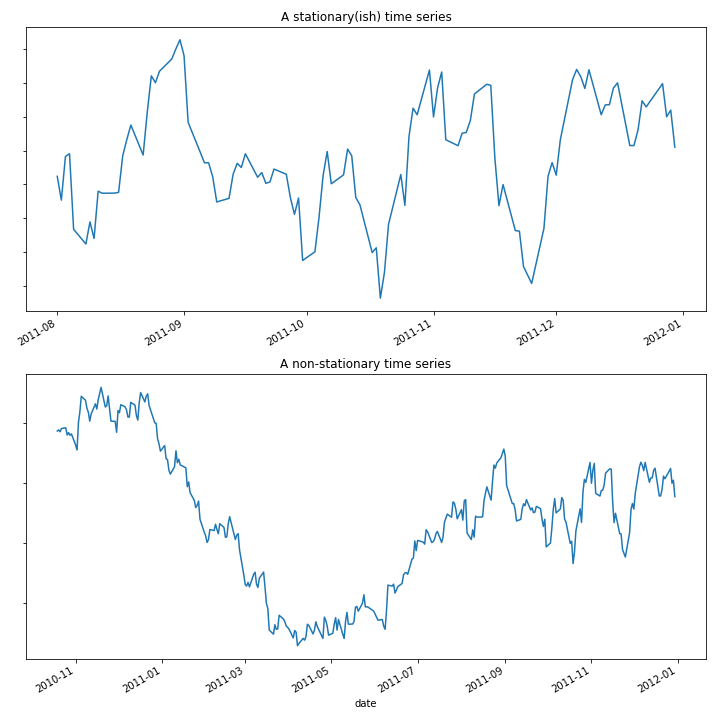
  • อนุกรมเวลาที่มีความนิ่งสถิตจะไม่เปลี่ยนแปลงคุณสมบัติทางสถิติเมื่อเวลาผ่านไป
  • เช่น ค่าเฉลี่ย ส่วนเบี่ยงเบนมาตรฐาน แนวโน้ม
  • อนุกรมเวลาส่วนใหญ่ไม่มีความนิ่งสถิตในระดับหนึ่ง
Machine Learning สำหรับข้อมูล Time Series ใน Python

Machine Learning สำหรับข้อมูล Time Series ใน Python

เสถียรภาพของโมเดล

  • ข้อมูลที่ไม่มีความนิ่งสถิตทำให้โมเดลมีความแปรปรวน
  • คุณสมบัติทางสถิติที่โมเดลค้นพบอาจเปลี่ยนแปลงตามข้อมูล
  • นอกจากนี้ยังทำให้ไม่แน่ใจเกี่ยวกับค่าพารามิเตอร์ของโมเดลที่ถูกต้อง
  • จะวัดค่านี้ได้อย่างไร?
Machine Learning สำหรับข้อมูล Time Series ใน Python

ใช้ cross-validation วัดเสถียรภาพของพารามิเตอร์

  • แนวทางหนึ่ง: ใช้ cross-validation
  • คำนวณพารามิเตอร์ของโมเดลในแต่ละรอบ
  • ประเมินเสถียรภาพของพารามิเตอร์ในทุก CV split
Machine Learning สำหรับข้อมูล Time Series ใน Python

Bootstrapping ค่าเฉลี่ย

  • Bootstrapping เป็นวิธีทั่วไปในการประเมินความแปรปรวน
  • ขั้นตอน Bootstrap:
    1. สุ่มตัวอย่างข้อมูลแบบเติมคืน
    2. คำนวณค่าเฉลี่ยของตัวอย่าง
    3. ทำซ้ำหลายรอบ (หลักพัน)
    4. คำนวณเปอร์เซ็นไทล์ของผลลัพธ์ (มักใช้ 2.5, 97.5)

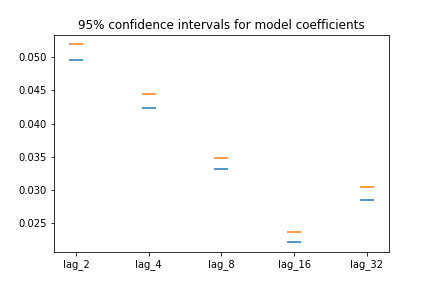
ผลลัพธ์คือ ช่วงความเชื่อมั่น 95% ของค่าเฉลี่ยของแต่ละสัมประสิทธิ์

Machine Learning สำหรับข้อมูล Time Series ใน Python

Bootstrapping ค่าเฉลี่ย

from sklearn.utils import resample

# cv_coefficients has shape (n_cv_folds, n_coefficients)
n_boots = 100
bootstrap_means = np.zeros(n_boots, n_coefficients)
for ii in range(n_boots):
    # Generate random indices for our data with replacement, 
    # then take the sample mean
    random_sample = resample(cv_coefficients)
    bootstrap_means[ii] = random_sample.mean(axis=0)

# Compute the percentiles of choice for the bootstrapped means
percentiles = np.percentile(bootstrap_means, (2.5, 97.5), axis=0)
Machine Learning สำหรับข้อมูล Time Series ใน Python

พล็อตสัมประสิทธิ์จาก Bootstrap

fig, ax = plt.subplots()
ax.scatter(many_shifts.columns, percentiles[0], marker='_', s=200)
ax.scatter(many_shifts.columns, percentiles[1], marker='_', s=200)
Machine Learning สำหรับข้อมูล Time Series ใน Python

ประเมินเสถียรภาพของประสิทธิภาพโมเดล

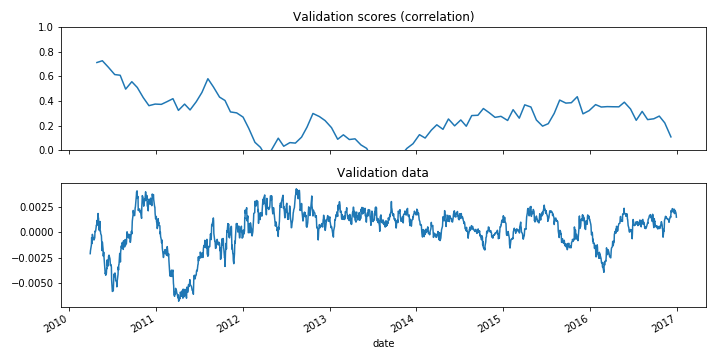
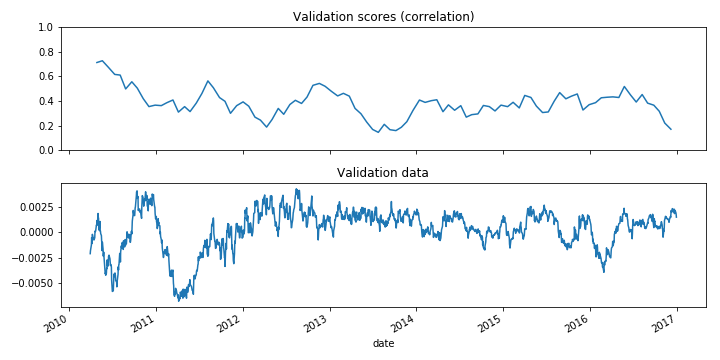
  • หากใช้ TimeSeriesSplit สามารถพล็อตคะแนนของโมเดลตามเวลาได้
  • ช่วยระบุช่วงเวลาที่ส่งผลเสียต่อคะแนน
  • ยังเป็นประโยชน์ในการค้นหาสัญญาณที่ไม่มีความนิ่งสถิต
Machine Learning สำหรับข้อมูล Time Series ใน Python

ประสิทธิภาพของโมเดลตามเวลา

def my_corrcoef(est, X, y):
    """Return the correlation coefficient 
    between model predictions and a validation set."""
    return np.corrcoef(y, est.predict(X))[1, 0]

# Grab the date of the first index of each validation set
first_indices = [data.index[tt[0]] for tr, tt in cv.split(X, y)]

# Calculate the CV scores and convert to a Pandas Series
cv_scores = cross_val_score(model, X, y, cv=cv, scoring=my_corrcoef)
cv_scores = pd.Series(cv_scores, index=first_indices)
Machine Learning สำหรับข้อมูล Time Series ใน Python

แสดงคะแนนโมเดลในรูปอนุกรมเวลา

fig, axs = plt.subplots(2, 1, figsize=(10, 5), sharex=True)

# Calculate a rolling mean of scores over time
cv_scores_mean = cv_scores.rolling(10, min_periods=1).mean()
cv_scores.plot(ax=axs[0])
axs[0].set(title='Validation scores (correlation)', ylim=[0, 1])

# Plot the raw data
data.plot(ax=axs[1])
axs[1].set(title='Validation data')
Machine Learning สำหรับข้อมูล Time Series ใน Python

แสดงคะแนนโมเดล

Machine Learning สำหรับข้อมูล Time Series ใน Python

Fixed window กับ time series cross-validation

# Only keep the last 100 datapoints in the training data
window = 100

# Initialize the CV with this window size
cv = TimeSeriesSplit(n_splits=10, max_train_size=window)
Machine Learning สำหรับข้อมูล Time Series ใน Python

สัญญาณที่ไม่มีความนิ่งสถิต

Machine Learning สำหรับข้อมูล Time Series ใน Python

มาฝึกกันเถอะ!

Machine Learning สำหรับข้อมูล Time Series ใน Python

Preparing Video For Download...