ฟีเจอร์ที่มีการหน่วงเวลาและโมเดล Auto-Regressive

Machine Learning สำหรับข้อมูล Time Series ใน Python

Chris Holdgraf

Fellow, Berkeley Institute for Data Science

อดีตมีประโยชน์

  • ข้อมูล Timeseries มักมีข้อมูลที่ ร่วมกันระหว่างจุดเวลา อยู่เสมอ
  • ข้อมูลในอดีตช่วยทำนายสิ่งที่จะเกิดขึ้นในอนาคตได้
  • ฟีเจอร์ที่เหมาะสมที่สุดในการทำนาย Timeseries มักคือค่าก่อนหน้าของ Timeseries เดียวกัน
Machine Learning สำหรับข้อมูล Time Series ใน Python

ความราบเรียบและ Auto-correlation

  • คำถามที่พบบ่อยสำหรับ Timeseries คือ ข้อมูลมีความราบเรียบแค่ไหน
  • กล่าวคือ จุดเวลาหนึ่งมีความสัมพันธ์กับจุดเวลาใกล้เคียงมากแค่ไหน (เรียกว่า autocorrelation)
  • ปริมาณ Auto-correlation ในข้อมูลจะส่งผลต่อโมเดลของคุณ
Machine Learning สำหรับข้อมูล Time Series ใน Python

การสร้างฟีเจอร์แบบ Time-lagged

  • มาดูวิธีสร้างโมเดลที่ใช้ค่าในอดีตเป็น Input Features
  • ใช้สิ่งนี้เพื่อประเมินระดับ Auto-correlation ของสัญญาณ (และอื่น ๆ อีกมาก)
Machine Learning สำหรับข้อมูล Time Series ใน Python

การเลื่อนข้อมูลตามเวลาด้วย Pandas

print(df)
         df 
    0   0.0
    1   1.0 
    2   2.0 
    3   3.0 
    4   4.0 
# Shift a DataFrame/Series by 3 index values towards the past
print(df.shift(3))
         df
    0   NaN
    1   NaN
    2   NaN
    3   0.0
    4   1.0
Machine Learning สำหรับข้อมูล Time Series ใน Python

การสร้าง DataFrame แบบ Time-shifted

# data is a pandas Series containing time series data
data = pd.Series(...)

# Shifts
shifts = [0, 1, 2, 3, 4, 5, 6, 7]

# Create a dictionary of time-shifted data
many_shifts = {'lag_{}'.format(ii): data.shift(ii) for ii in shifts}

# Convert them into a dataframe
many_shifts = pd.DataFrame(many_shifts)
Machine Learning สำหรับข้อมูล Time Series ใน Python

การ Fit โมเดลด้วยฟีเจอร์แบบ Time-shifted

# Fit the model using these input features 
model = Ridge() 
model.fit(many_shifts, data)
Machine Learning สำหรับข้อมูล Time Series ใน Python

การตีความค่าสัมประสิทธิ์ของโมเดล Auto-Regressive

# Visualize the fit model coefficients
fig, ax = plt.subplots()
ax.bar(many_shifts.columns, model.coef_)
ax.set(xlabel='Coefficient name', ylabel='Coefficient value')

# Set formatting so it looks nice
plt.setp(ax.get_xticklabels(), rotation=45, horizontalalignment='right')
Machine Learning สำหรับข้อมูล Time Series ใน Python

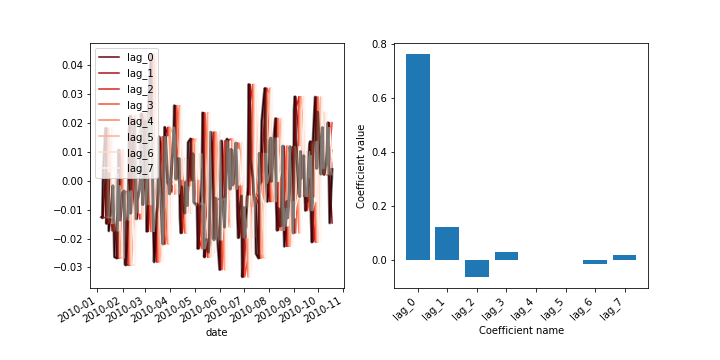
แสดงค่าสัมประสิทธิ์สำหรับสัญญาณที่ขรุขระ
Machine Learning สำหรับข้อมูล Time Series ใน Python

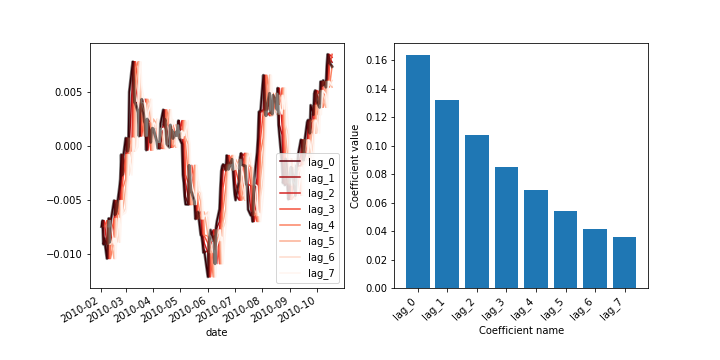
แสดงค่าสัมประสิทธิ์สำหรับสัญญาณที่ราบเรียบ
Machine Learning สำหรับข้อมูล Time Series ใน Python

มาฝึกกันเถอะ!

Machine Learning สำหรับข้อมูล Time Series ใน Python

Preparing Video For Download...