CI/CD для машинного навчання
Ravi Bhadauria
Machine Learning Engineer
outsstages:
preprocess:
...
train:
...
outs:
- metrics.json
- confusion_matrix.png
metricsstages: preprocess: ... train: ... outs: - confusion_matrix.pngmetrics: - metrics.json: cache: false
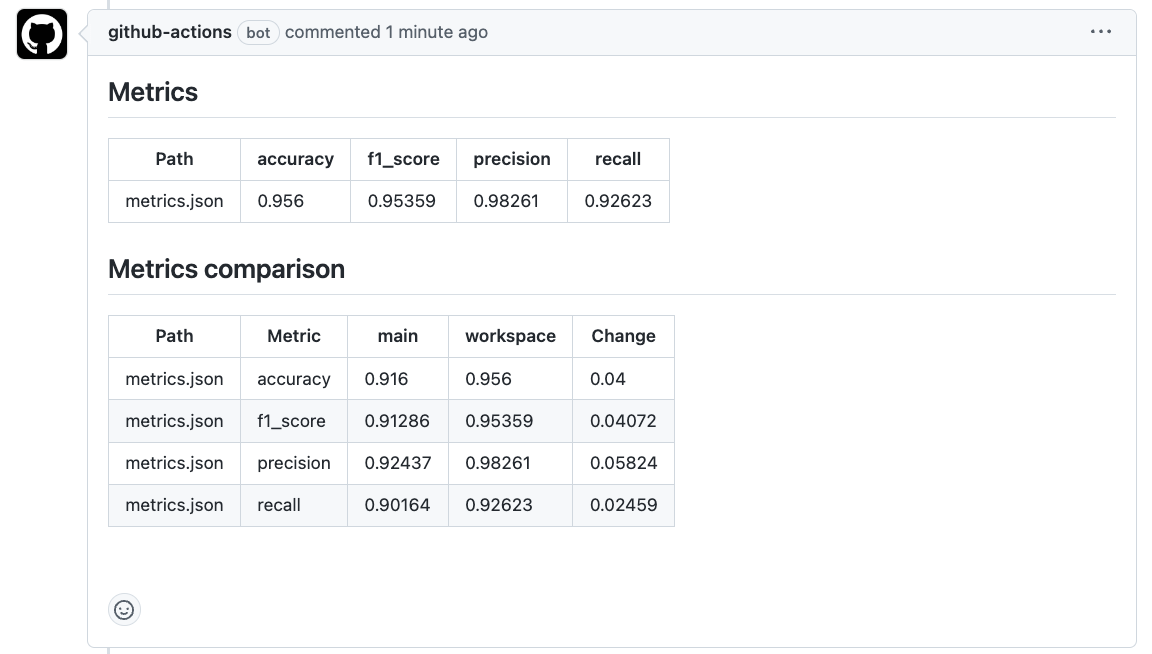
-> dvc metrics showPath accuracy f1_score precision recall metrics.json 0.947 0.8656 0.988 0.7702
Змініть гіперпараметр і перезапустіть dvc repro
-> dvc metrics diffPath Metric HEAD workspace Change metrics.json accuracy 0.947 0.9995 0.0525 metrics.json f1_score 0.8656 0.9989 0.1333 metrics.json precision 0.988 0.9993 0.0113 metrics.json recall 0.7702 0.9986 0.2284
setup-dvc GitHub Actionsteps: ... - name: Setup DVC uses: iterative/setup-dvc@v1- name: Run DVC pipeline run: dvc repro
- name: Write CML report env: REPO_TOKEN: ${{ secrets.GITHUB_TOKEN }} run: | # Вивести метрики поточної гілки dvc metrics show --md >> report.md# Порівняти метрики з гілкою main git fetch --prune dvc metrics diff --md main >> report.md# Створити звіт CML cml comment create report.md

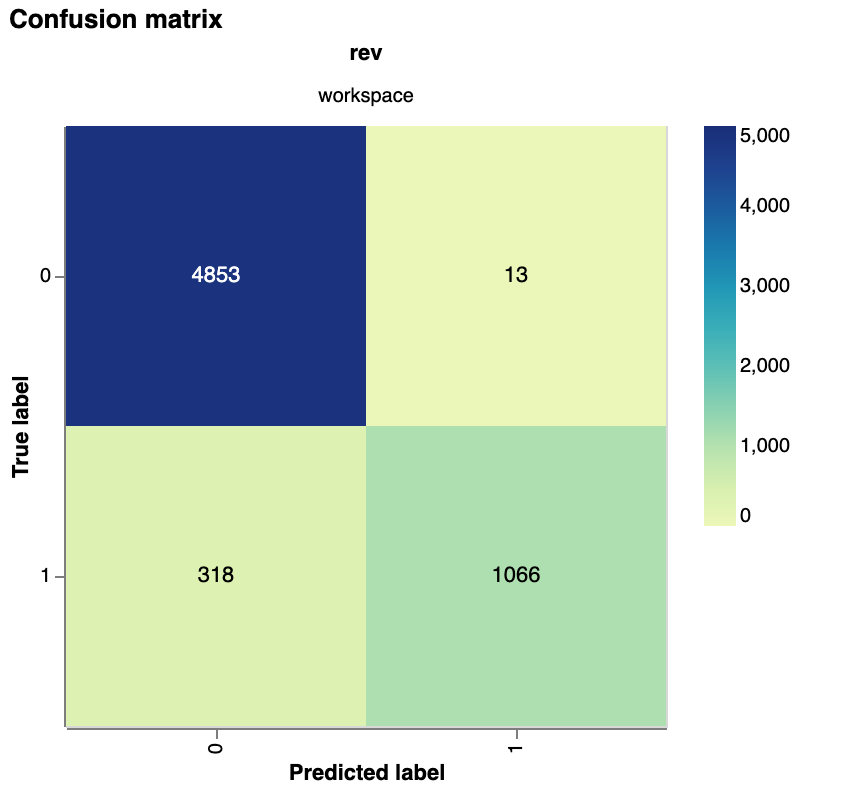
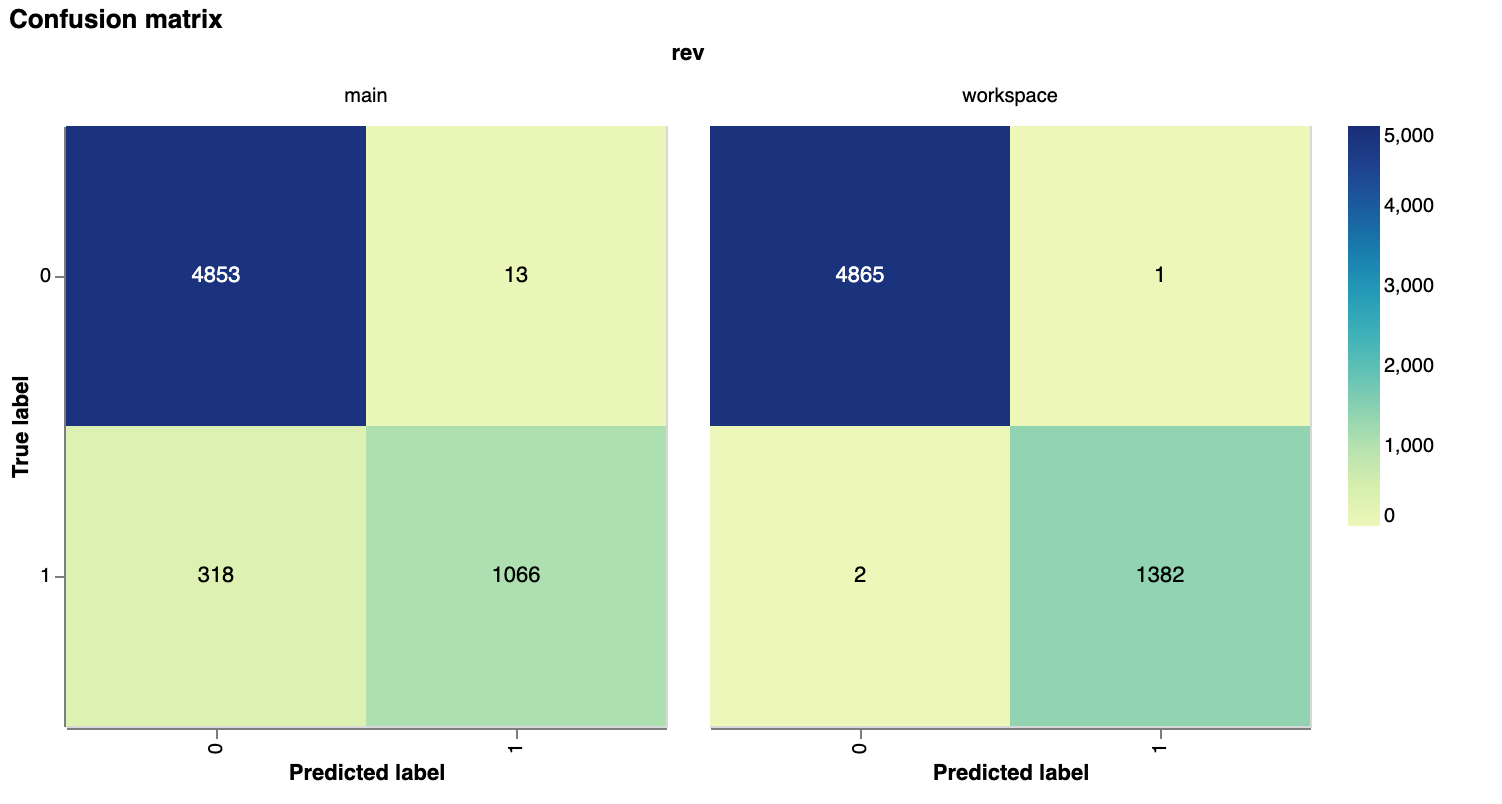
scatter — точкова діаграмаlinear — інтерактивна лінійна діаграмаsimple — неінтерактивна настроювана лінійна діаграмаsmooth — лінійна діаграма зі згладжуваннямconfusion — матриця помилокconfusion_normalized — матриця помилок з нормованими до діапазону <0, 1> значеннямиbar_horizontal — горизонтальна стовпчикова діаграмаbar_horizontal_sorted — горизонтальна стовпчикова діаграма, відсортована за розміром стовпчиківstages: train: ... plots: - predictions.csv: # Імʼя файлу з передбаченнями template: confusion # Стиль графікаx: predicted_label # Назва колонки по осі X у csv-файлі y: true_label # Назва колонки по осі Y у csv-файлі x_label: 'Predicted label' y_label: 'True label' title: Confusion matrixcache: false # Зберігати в Git
-> dvc plots show predictions.csv
file:///path/to/index.html

-> dvc plots diff --target predictions.csv main
file:///path/to/index.html

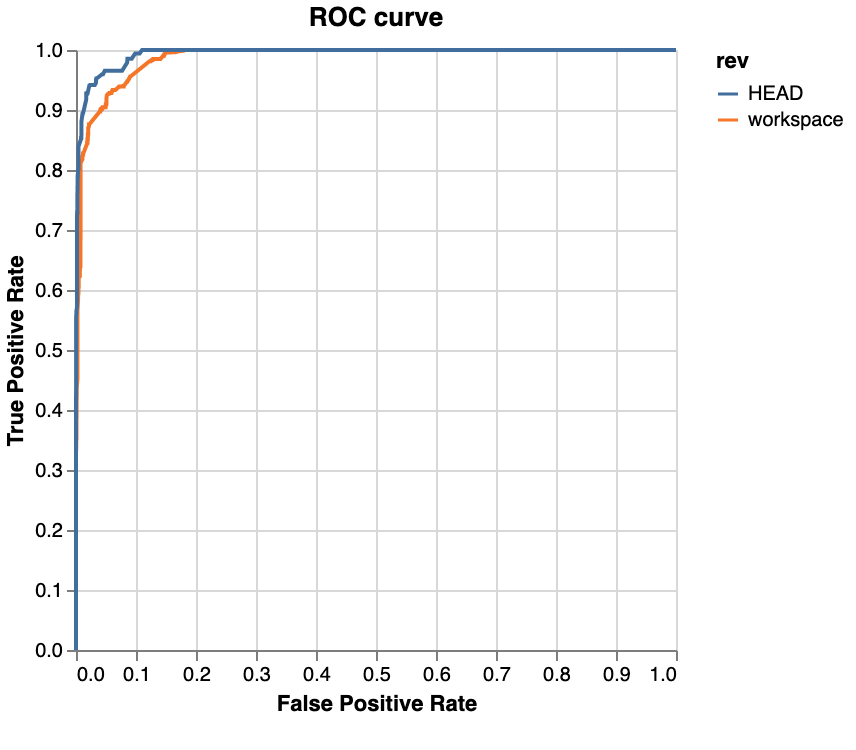
# Зміни в Python
y_proba = model.predict_proba(X_test)
fpr, tpr, _ = roc_curve(y_test,
y_proba[:, 1])
# Зміни в dvc.yaml
plots:
- roc_curve.csv:
template: simple
x: fpr
y: tpr
x_label: 'False Positive Rate'
y_label: 'True Positive Rate'
title: ROC curve
cache: false

CI/CD для машинного навчання