Indexkorrelation & export till Excel

Manipulera tidsseriedata i Python

Stefan Jansen

Founder & Lead Data Scientist at Applied Artificial Intelligence

Ytterligare analys av ditt index

  • Korrelationer för daglig avkastning:

  • Beräkna för alla komponenter

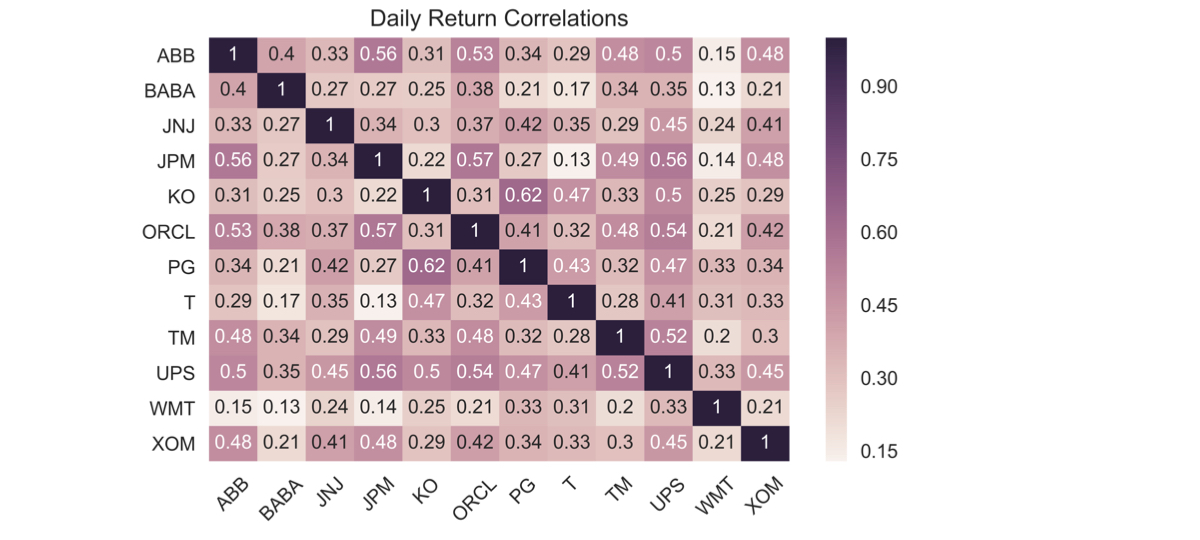
  • Visualisera resultatet som värmekarta

  • Exportera till Excel med formaten .xls och .xlsx:

  • Enskilt kalkylblad

  • Flera kalkylblad

Manipulera tidsseriedata i Python

Indexkomponenter – prisdata

data = DataReader(tickers, 'google', start='2016', end='2017')['Close']

data.info()
DatetimeIndex: 252 entries, 2016-01-04 to 2016-12-30
Data columns (total 12 columns):
ABB     252 non-null float64
BABA    252 non-null float64
JNJ     252 non-null float64
JPM     252 non-null float64
KO      252 non-null float64
ORCL    252 non-null float64
PG      252 non-null float64
T       252 non-null float64
TM      252 non-null float64
UPS     252 non-null float64
WMT     252 non-null float64
XOM     252 non-null float64
Manipulera tidsseriedata i Python

Indexkomponenter: avkastningskorrelationer

daily_returns = data.pct_change()

correlations = daily_returns.corr()
ABB  BABA  JNJ  JPM   KO  ORCL   PG    T   TM  UPS  WMT  XOM
ABB  1.00  0.40 0.33 0.56 0.31  0.53 0.34 0.29 0.48 0.50 0.15 0.48
BABA 0.40  1.00 0.27 0.27 0.25  0.38 0.21 0.17 0.34 0.35 0.13 0.21
JNJ  0.33  0.27 1.00 0.34 0.30  0.37 0.42 0.35 0.29 0.45 0.24 0.41
JPM  0.56  0.27 0.34 1.00 0.22  0.57 0.27 0.13 0.49 0.56 0.14 0.48
KO   0.31  0.25 0.30 0.22 1.00  0.31 0.62 0.47 0.33 0.50 0.25 0.29
ORCL 0.53  0.38 0.37 0.57 0.31  1.00 0.41 0.32 0.48 0.54 0.21 0.42
PG   0.34  0.21 0.42 0.27 0.62  0.41 1.00 0.43 0.32 0.47 0.33 0.34
T    0.29  0.17 0.35 0.13 0.47  0.32 0.43 1.00 0.28 0.41 0.31 0.33
TM   0.48  0.34 0.29 0.49 0.33  0.48 0.32 0.28 1.00 0.52 0.20 0.30
UPS  0.50  0.35 0.45 0.56 0.50  0.54 0.47 0.41 0.52 1.00 0.33 0.45
WMT  0.15  0.13 0.24 0.14 0.25  0.21 0.33 0.31 0.20 0.33 1.00 0.21
XOM  0.48  0.21 0.41 0.48 0.29  0.42 0.34 0.33 0.30 0.45 0.21 1.00
Manipulera tidsseriedata i Python

Indexkomponenter: avkastningskorrelationer

sns.heatmap(correlations, annot=True)
plt.xticks(rotation=45)
plt.title('Daily Return Correlations')
ch4_4_v2 - Index Correlation & Saving Results to Excel.010.png

Manipulera tidsseriedata i Python

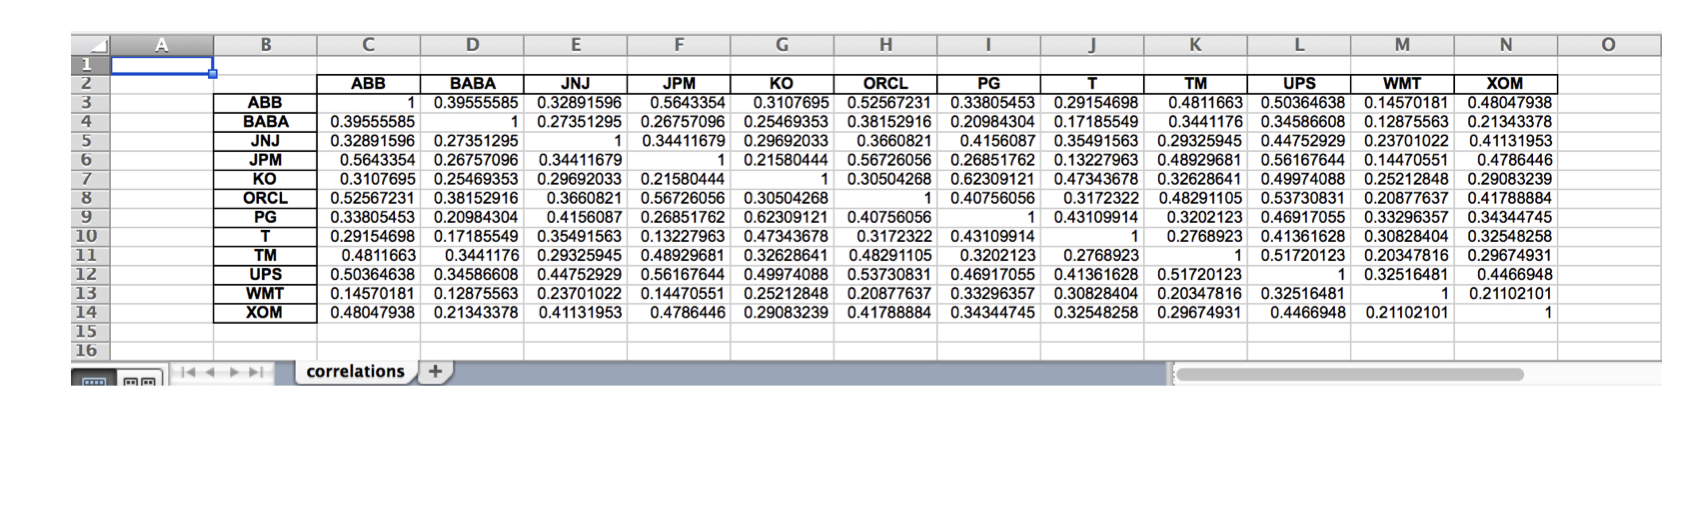
Spara till ett enskilt Excel-kalkylblad

correlations.to_excel(excel_writer= 'correlations.xls',
                      sheet_name='correlations',
                      startrow=1,
                      startcol=1)
ch4_4_v2 - Index Correlation & Saving Results to Excel.012.png

Manipulera tidsseriedata i Python

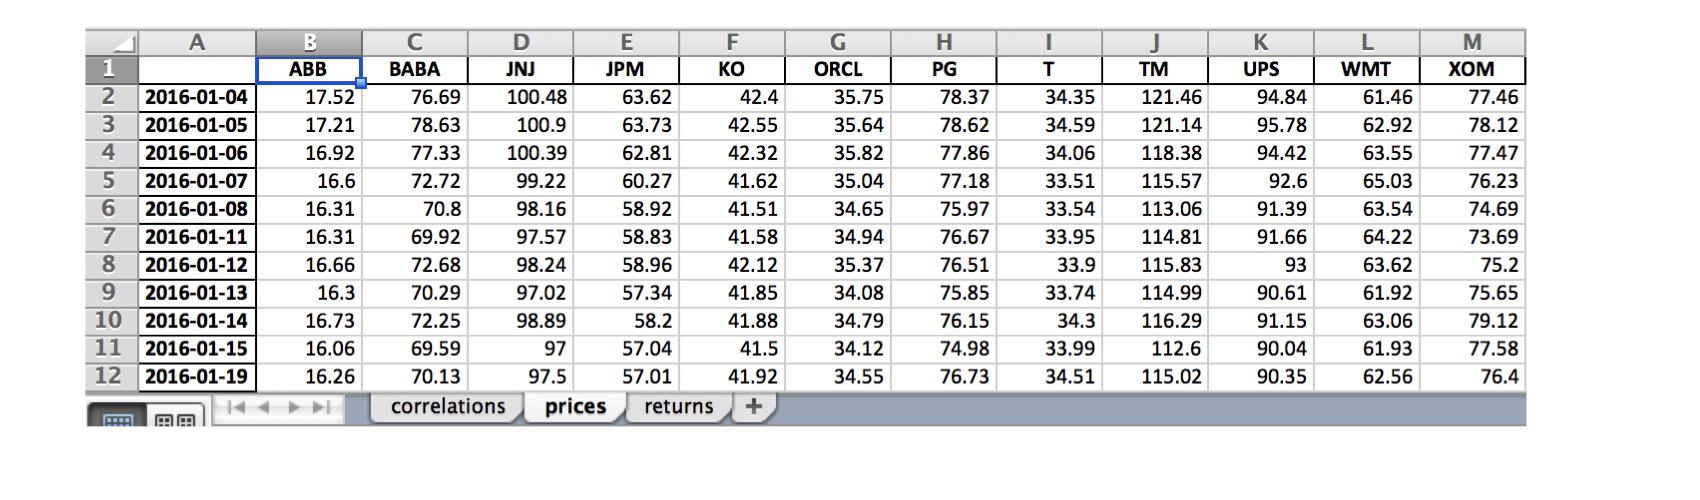
Spara till flera Excel-kalkylblad

data.index = data.index.date # Keep only date component

with pd.ExcelWriter('stock_data.xlsx') as writer:
corr.to_excel(excel_writer=writer, sheet_name='correlations')
data.to_excel(excel_writer=writer, sheet_name='prices')
data.pct_change().to_excel(writer, sheet_name='returns')
ch4_4_v2 - Index Correlation & Saving Results to Excel.015.png

Manipulera tidsseriedata i Python

Nu kör vi en övning!

Manipulera tidsseriedata i Python

Preparing Video For Download...