ความสัมพันธ์ของดัชนีและการส่งออกไปยัง Excel

การจัดการข้อมูล Time Series ใน Python

Stefan Jansen

Founder & Lead Data Scientist at Applied Artificial Intelligence

การวิเคราะห์เพิ่มเติมสำหรับดัชนี

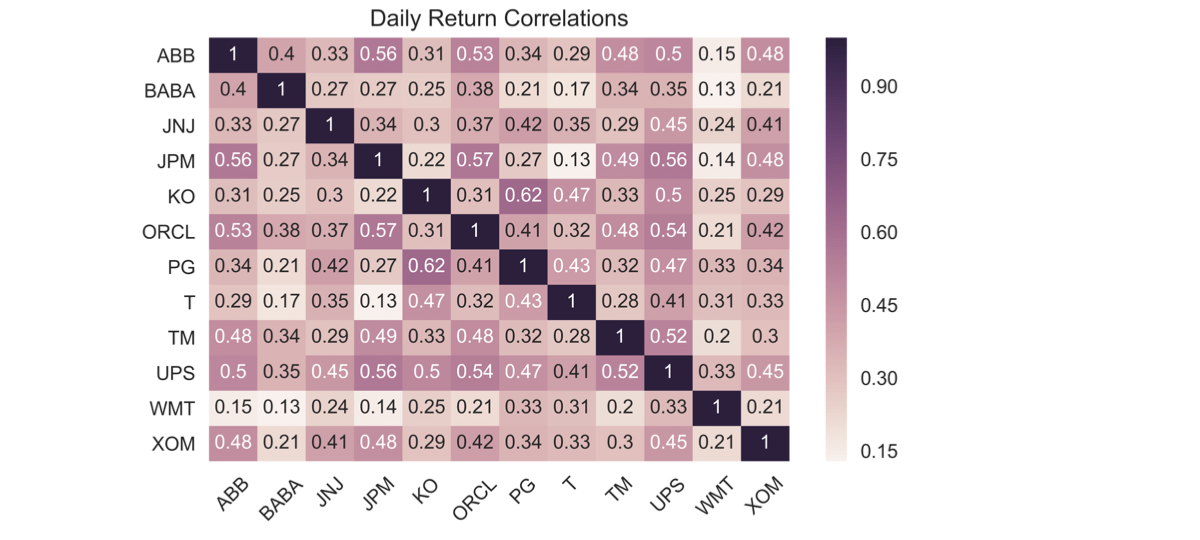
  • ความสัมพันธ์ของผลตอบแทนรายวัน:

  • คำนวณระหว่างองค์ประกอบทั้งหมด

  • แสดงผลเป็น heatmap

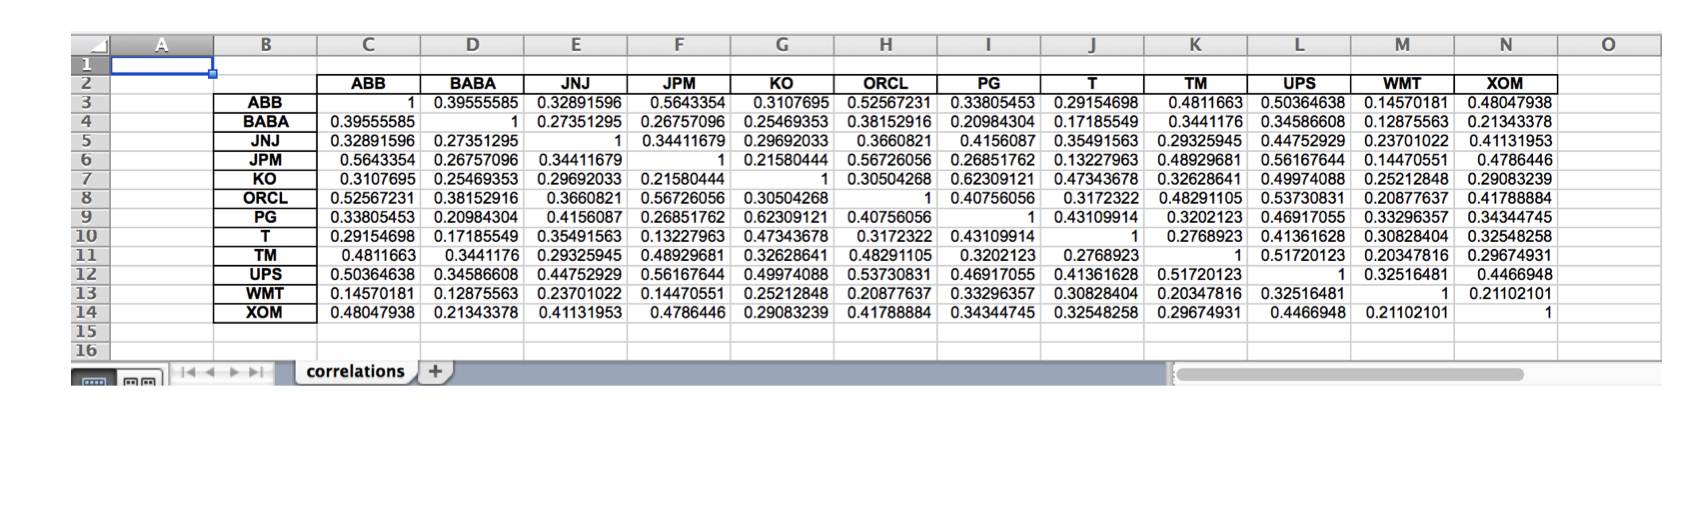
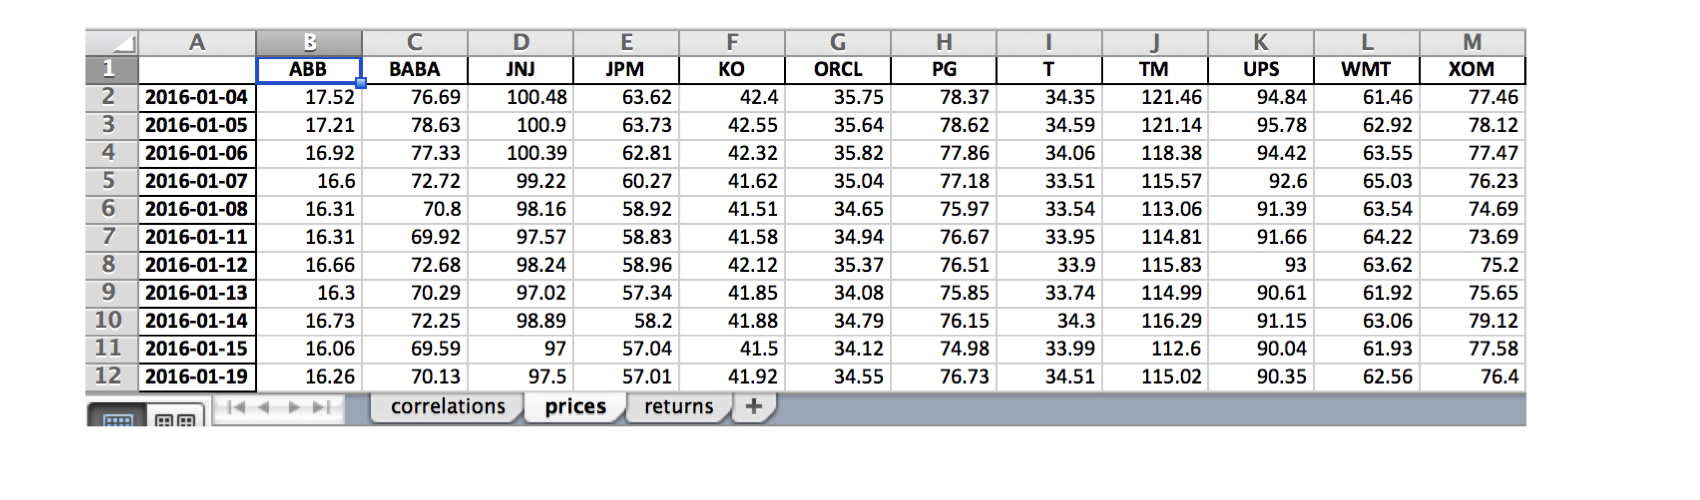
  • บันทึกผลลัพธ์ลง Excel ในรูปแบบ .xls และ .xlsx:

  • เวิร์กชีตเดียว

  • หลายเวิร์กชีต

การจัดการข้อมูล Time Series ใน Python

องค์ประกอบดัชนี - ข้อมูลราคา

data = DataReader(tickers, 'google', start='2016', end='2017')['Close']

data.info()
DatetimeIndex: 252 entries, 2016-01-04 to 2016-12-30
Data columns (total 12 columns):
ABB     252 non-null float64
BABA    252 non-null float64
JNJ     252 non-null float64
JPM     252 non-null float64
KO      252 non-null float64
ORCL    252 non-null float64
PG      252 non-null float64
T       252 non-null float64
TM      252 non-null float64
UPS     252 non-null float64
WMT     252 non-null float64
XOM     252 non-null float64
การจัดการข้อมูล Time Series ใน Python

องค์ประกอบดัชนี: ความสัมพันธ์ของผลตอบแทน

daily_returns = data.pct_change()

correlations = daily_returns.corr()
ABB  BABA  JNJ  JPM   KO  ORCL   PG    T   TM  UPS  WMT  XOM
ABB  1.00  0.40 0.33 0.56 0.31  0.53 0.34 0.29 0.48 0.50 0.15 0.48
BABA 0.40  1.00 0.27 0.27 0.25  0.38 0.21 0.17 0.34 0.35 0.13 0.21
JNJ  0.33  0.27 1.00 0.34 0.30  0.37 0.42 0.35 0.29 0.45 0.24 0.41
JPM  0.56  0.27 0.34 1.00 0.22  0.57 0.27 0.13 0.49 0.56 0.14 0.48
KO   0.31  0.25 0.30 0.22 1.00  0.31 0.62 0.47 0.33 0.50 0.25 0.29
ORCL 0.53  0.38 0.37 0.57 0.31  1.00 0.41 0.32 0.48 0.54 0.21 0.42
PG   0.34  0.21 0.42 0.27 0.62  0.41 1.00 0.43 0.32 0.47 0.33 0.34
T    0.29  0.17 0.35 0.13 0.47  0.32 0.43 1.00 0.28 0.41 0.31 0.33
TM   0.48  0.34 0.29 0.49 0.33  0.48 0.32 0.28 1.00 0.52 0.20 0.30
UPS  0.50  0.35 0.45 0.56 0.50  0.54 0.47 0.41 0.52 1.00 0.33 0.45
WMT  0.15  0.13 0.24 0.14 0.25  0.21 0.33 0.31 0.20 0.33 1.00 0.21
XOM  0.48  0.21 0.41 0.48 0.29  0.42 0.34 0.33 0.30 0.45 0.21 1.00
การจัดการข้อมูล Time Series ใน Python

องค์ประกอบดัชนี: ความสัมพันธ์ของผลตอบแทน

sns.heatmap(correlations, annot=True)
plt.xticks(rotation=45)
plt.title('Daily Return Correlations')
ความสัมพันธ์ของดัชนีและการบันทึกผลลัพธ์ลง Excel

การจัดการข้อมูล Time Series ใน Python

การบันทึกลงเวิร์กชีต Excel เดียว

correlations.to_excel(excel_writer= 'correlations.xls',
                      sheet_name='correlations',
                      startrow=1,
                      startcol=1)
ความสัมพันธ์ของดัชนีและการบันทึกผลลัพธ์ลง Excel

การจัดการข้อมูล Time Series ใน Python

การบันทึกลงหลายเวิร์กชีต Excel

data.index = data.index.date # Keep only date component

with pd.ExcelWriter('stock_data.xlsx') as writer:
corr.to_excel(excel_writer=writer, sheet_name='correlations')
data.to_excel(excel_writer=writer, sheet_name='prices')
data.pct_change().to_excel(writer, sheet_name='returns')
ความสัมพันธ์ของดัชนีและการบันทึกผลลัพธ์ลง Excel

การจัดการข้อมูล Time Series ใน Python

มาฝึกกันเถอะ!

การจัดการข้อมูล Time Series ใน Python

Preparing Video For Download...