Опрацювання часових рядів у Python
Stefan Jansen
Founder & Lead Data Scientist at Applied Artificial Intelligence
Кореляції щоденних доходностей:
Обчисліть для всіх компонентів
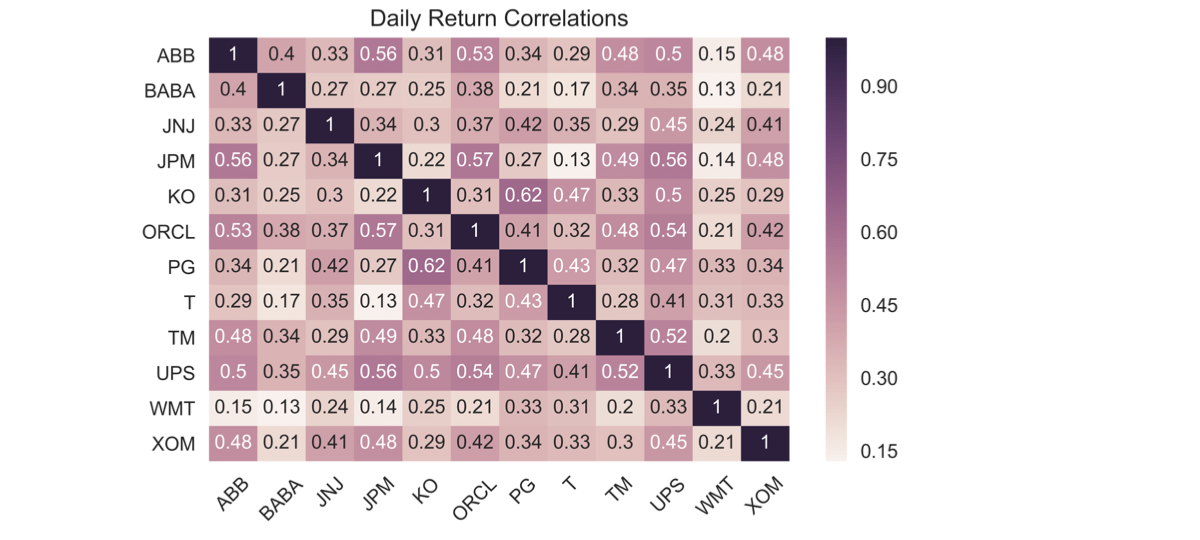
Візуалізуйте результат як теплокарту
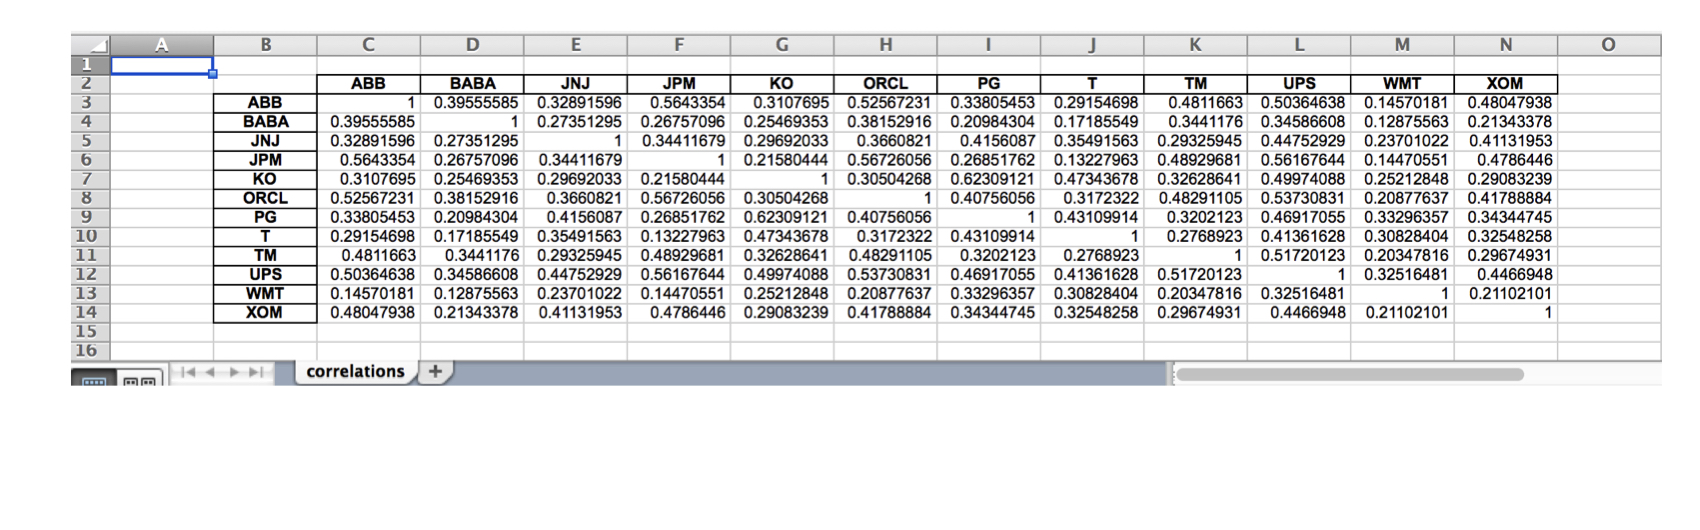
Запишіть результати в Excel у форматах .xls і .xlsx:
Один аркуш
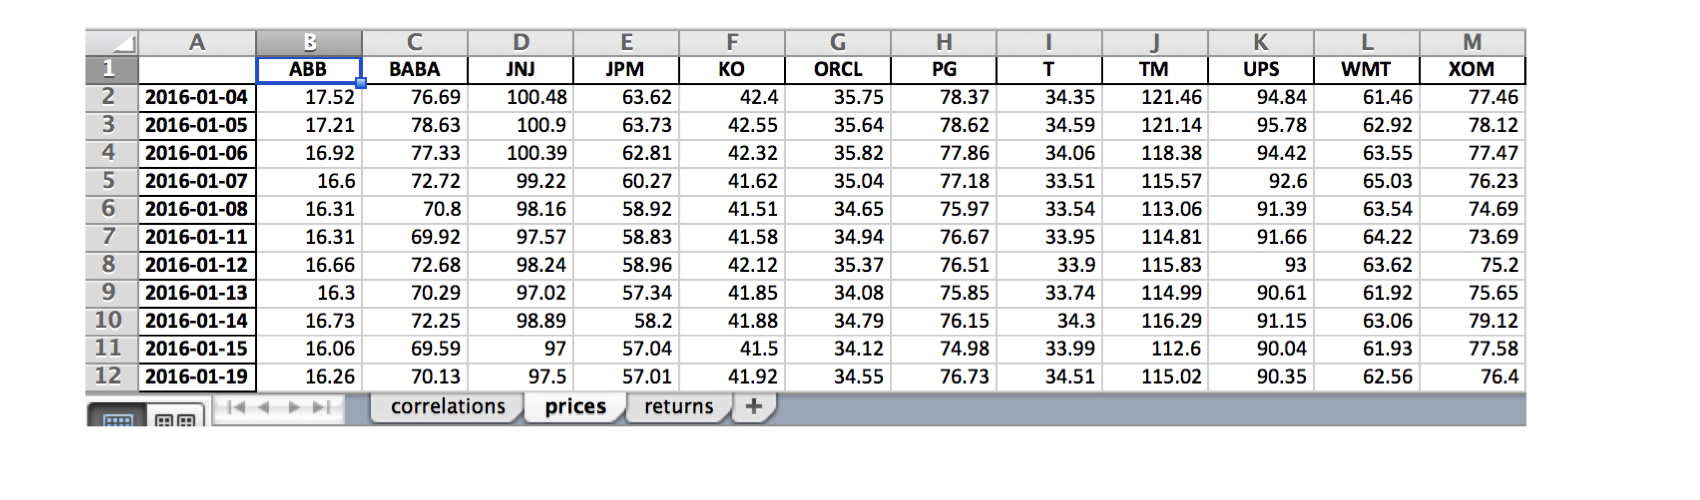
Кілька аркушів
data = DataReader(tickers, 'google', start='2016', end='2017')['Close']data.info()
DatetimeIndex: 252 entries, 2016-01-04 to 2016-12-30
Data columns (total 12 columns):
ABB 252 non-null float64
BABA 252 non-null float64
JNJ 252 non-null float64
JPM 252 non-null float64
KO 252 non-null float64
ORCL 252 non-null float64
PG 252 non-null float64
T 252 non-null float64
TM 252 non-null float64
UPS 252 non-null float64
WMT 252 non-null float64
XOM 252 non-null float64
daily_returns = data.pct_change()correlations = daily_returns.corr()
ABB BABA JNJ JPM KO ORCL PG T TM UPS WMT XOM
ABB 1.00 0.40 0.33 0.56 0.31 0.53 0.34 0.29 0.48 0.50 0.15 0.48
BABA 0.40 1.00 0.27 0.27 0.25 0.38 0.21 0.17 0.34 0.35 0.13 0.21
JNJ 0.33 0.27 1.00 0.34 0.30 0.37 0.42 0.35 0.29 0.45 0.24 0.41
JPM 0.56 0.27 0.34 1.00 0.22 0.57 0.27 0.13 0.49 0.56 0.14 0.48
KO 0.31 0.25 0.30 0.22 1.00 0.31 0.62 0.47 0.33 0.50 0.25 0.29
ORCL 0.53 0.38 0.37 0.57 0.31 1.00 0.41 0.32 0.48 0.54 0.21 0.42
PG 0.34 0.21 0.42 0.27 0.62 0.41 1.00 0.43 0.32 0.47 0.33 0.34
T 0.29 0.17 0.35 0.13 0.47 0.32 0.43 1.00 0.28 0.41 0.31 0.33
TM 0.48 0.34 0.29 0.49 0.33 0.48 0.32 0.28 1.00 0.52 0.20 0.30
UPS 0.50 0.35 0.45 0.56 0.50 0.54 0.47 0.41 0.52 1.00 0.33 0.45
WMT 0.15 0.13 0.24 0.14 0.25 0.21 0.33 0.31 0.20 0.33 1.00 0.21
XOM 0.48 0.21 0.41 0.48 0.29 0.42 0.34 0.33 0.30 0.45 0.21 1.00
sns.heatmap(correlations, annot=True)
plt.xticks(rotation=45)
plt.title('Daily Return Correlations')
correlations.to_excel(excel_writer= 'correlations.xls',
sheet_name='correlations',
startrow=1,
startcol=1)
data.index = data.index.date # Keep only date componentwith pd.ExcelWriter('stock_data.xlsx') as writer:corr.to_excel(excel_writer=writer, sheet_name='correlations')data.to_excel(excel_writer=writer, sheet_name='prices')data.pct_change().to_excel(writer, sheet_name='returns')
Опрацювання часових рядів у Python