แนะนำ Dash AG Grid

การสร้างแดชบอร์ดด้วย Dash และ Plotly

Alex Scriven

Data Scientist

Dash AG Grid คืออะไร?


  • HTML table tag (ใช้ได้ใน Dash)
  • html.Table เป็น static → จำกัดความสามารถ

$$

  • Dash AG Grid - dynamic และโต้ตอบได้
    • ฟิลเตอร์, ซ่อนคอลัมน์, ส่งออก, จัดสไตล์
การสร้างแดชบอร์ดด้วย Dash และ Plotly

ตารางพื้นฐาน


from dash_ag_grid import AgGrid

column_defs = [ {"field": "Major Category"}, {"field": "Total Sales ($)"}, {"field": "Sales Volume"}, ]


grid = AgGrid(
columnDefs=column_defs,

rowData=major_cat_tb.to_dict("records"))
app.layout = [grid]

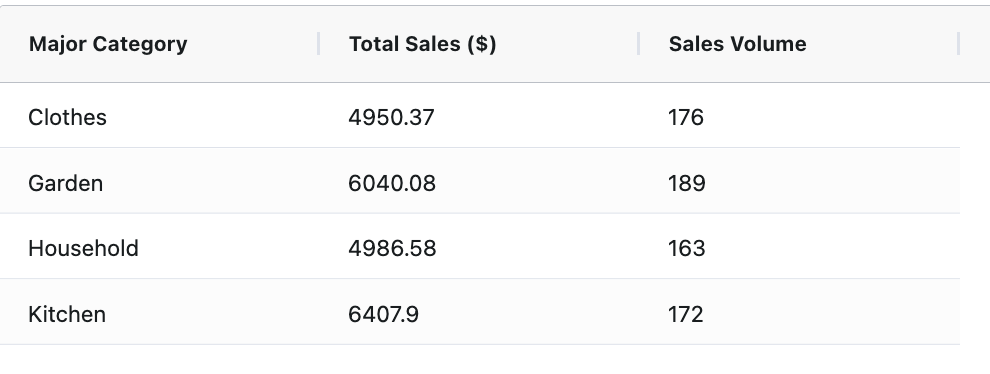
ตารางที่มี 3 คอลัมน์และ 4 แถว แสดงข้อมูลจากชุดข้อมูล e-commerce ส่วนหัวคอลัมน์ได้แก่ "Major Category" ซึ่งมีข้อความในเซลล์, "Total Sales ($)" ซึ่งมีค่าตัวเลข และ "Sales Volume" ซึ่งมีค่าจำนวนเต็ม

การสร้างแดชบอร์ดด้วย Dash และ Plotly

จัดรูปแบบตัวเลข

  • ปัญหา: รูปแบบตัวเลขทางการเงิน
    • วิธีแก้: ใช้ valueFormatter
    • ฟังก์ชันฟอร์แมตของ JavaScript
money_fmt = {
"function": (
    """params.value.toLocaleString(
    'en-US', {style: 'currency', currency: 'USD'})"""
)}

column_defs = [ {"field": "Major Category"}, {"field": "Total Sales ($)", "valueFormatter": money_fmt}, {"field": "Sales Volume"} ] # Add to layout as before
การสร้างแดชบอร์ดด้วย Dash และ Plotly

ผลลัพธ์การจัดรูปแบบตัวเลข


  • จัดรูปแบบเรียบร้อย ✨


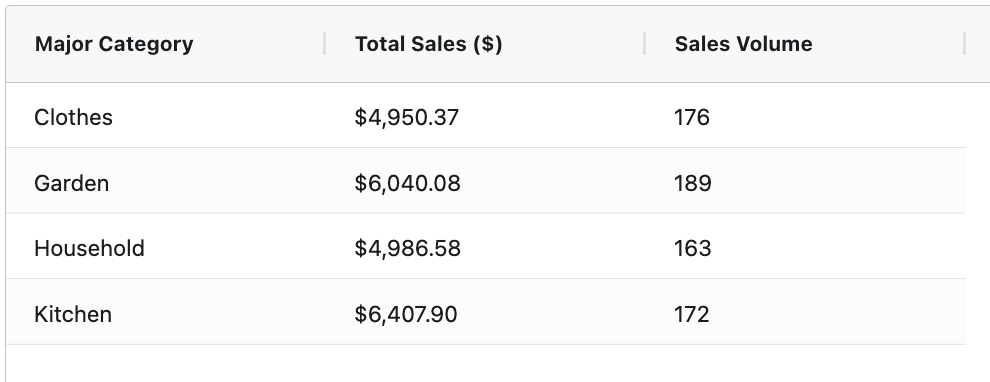
ตารางเดียวกับสไลด์ก่อนหน้า แต่คอลัมน์ Total Sales แสดงค่าพร้อมเครื่องหมายดอลลาร์นำหน้าและทศนิยม 2 ตำแหน่ง ตารางมี 3 คอลัมน์และ 4 แถว ส่วนหัวคอลัมน์ได้แก่ "Major Category", "Total Sales ($)" และ "Sales Volume"

การสร้างแดชบอร์ดด้วย Dash และ Plotly

เพิ่มการเรียงลำดับ

  • การเรียงลำดับเปิดใช้งานโดยค่าเริ่มต้น ⭐
# Turn off globally
grid = AgGrid(
  defaultColDef={"sortable": False}
)

# Specify for a column column_defs = [ {"field": "Major Category" , "sortable": True}, # Turn on {"field": "Sales Volume" , "sortable": False} # Turn off ]

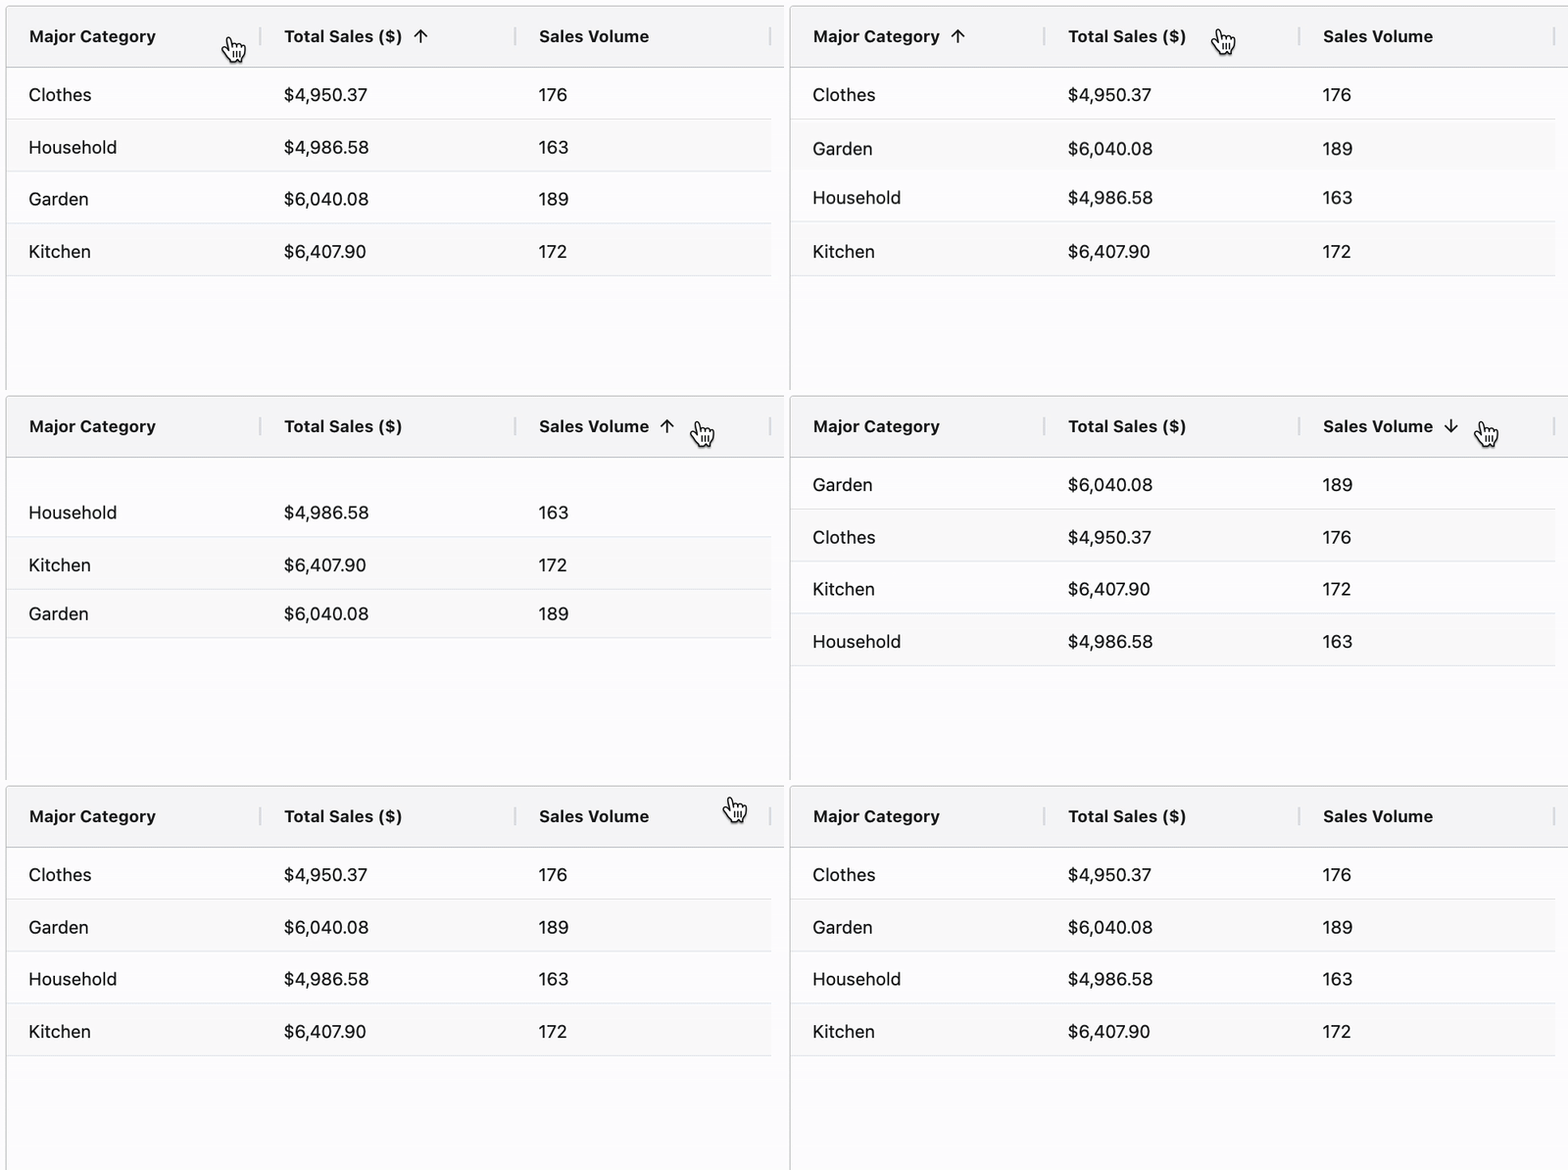
$$ GIF ของตารางพื้นฐาน เมื่อคลิกที่ส่วนหัวคอลัมน์ แถวข้อมูลจะเรียงลำดับตาม

การสร้างแดชบอร์ดด้วย Dash และ Plotly

เพิ่มการกรองข้อมูล


grid = AgGrid(
defaultColDef={
  "filter": True
  , "floatingFilter": True}
)

$$

  • รองรับการกรองแบบค่าและเงื่อนไข

$$

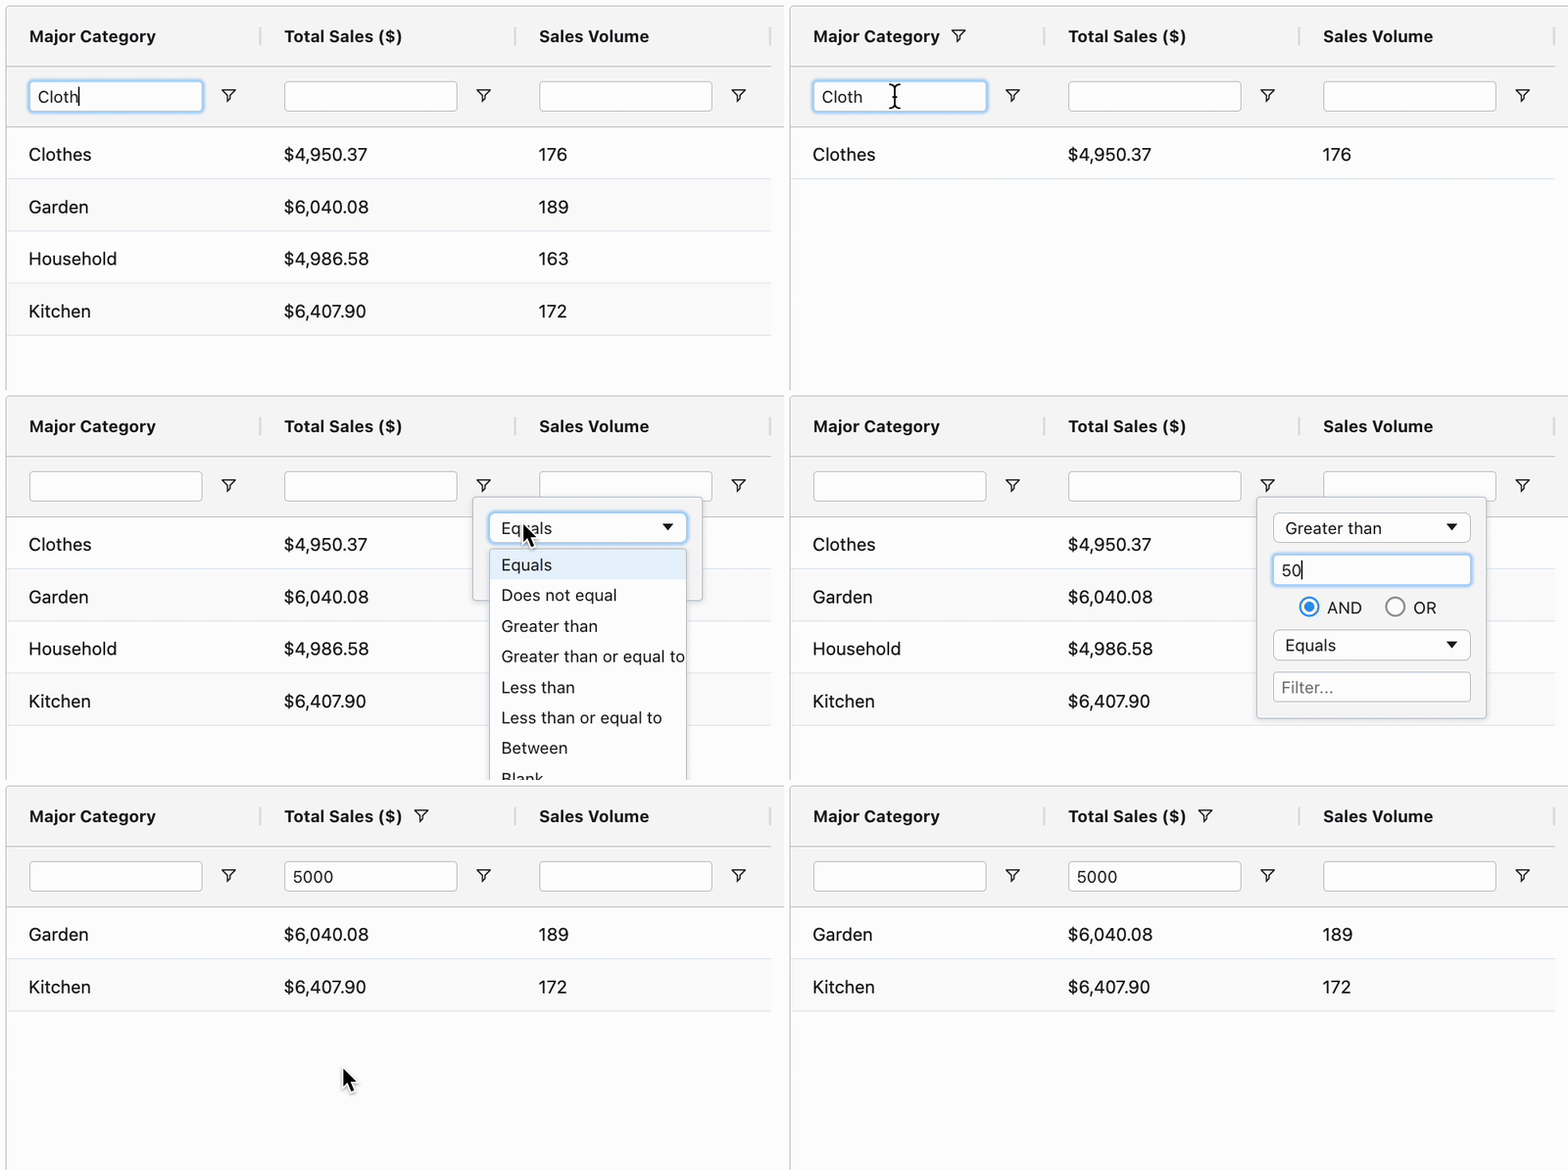
GIF ของตารางพื้นฐาน โดยมีแถวช่องว่างใต้ส่วนหัวสำหรับกรองข้อมูล GIF แสดงการกรองคอลัมน์แรกด้วย Cloth และคอลัมน์ที่สองด้วยเมนู Greater than

การสร้างแดชบอร์ดด้วย Dash และ Plotly

Pagination

  • ใช้ pagination สำหรับตารางที่มีข้อมูลจำนวนมาก 💡

$$

grid = AgGrid(
    dashGridOptions={
    "pagination": True,        
    "paginationPageSize": 2
    }

$$

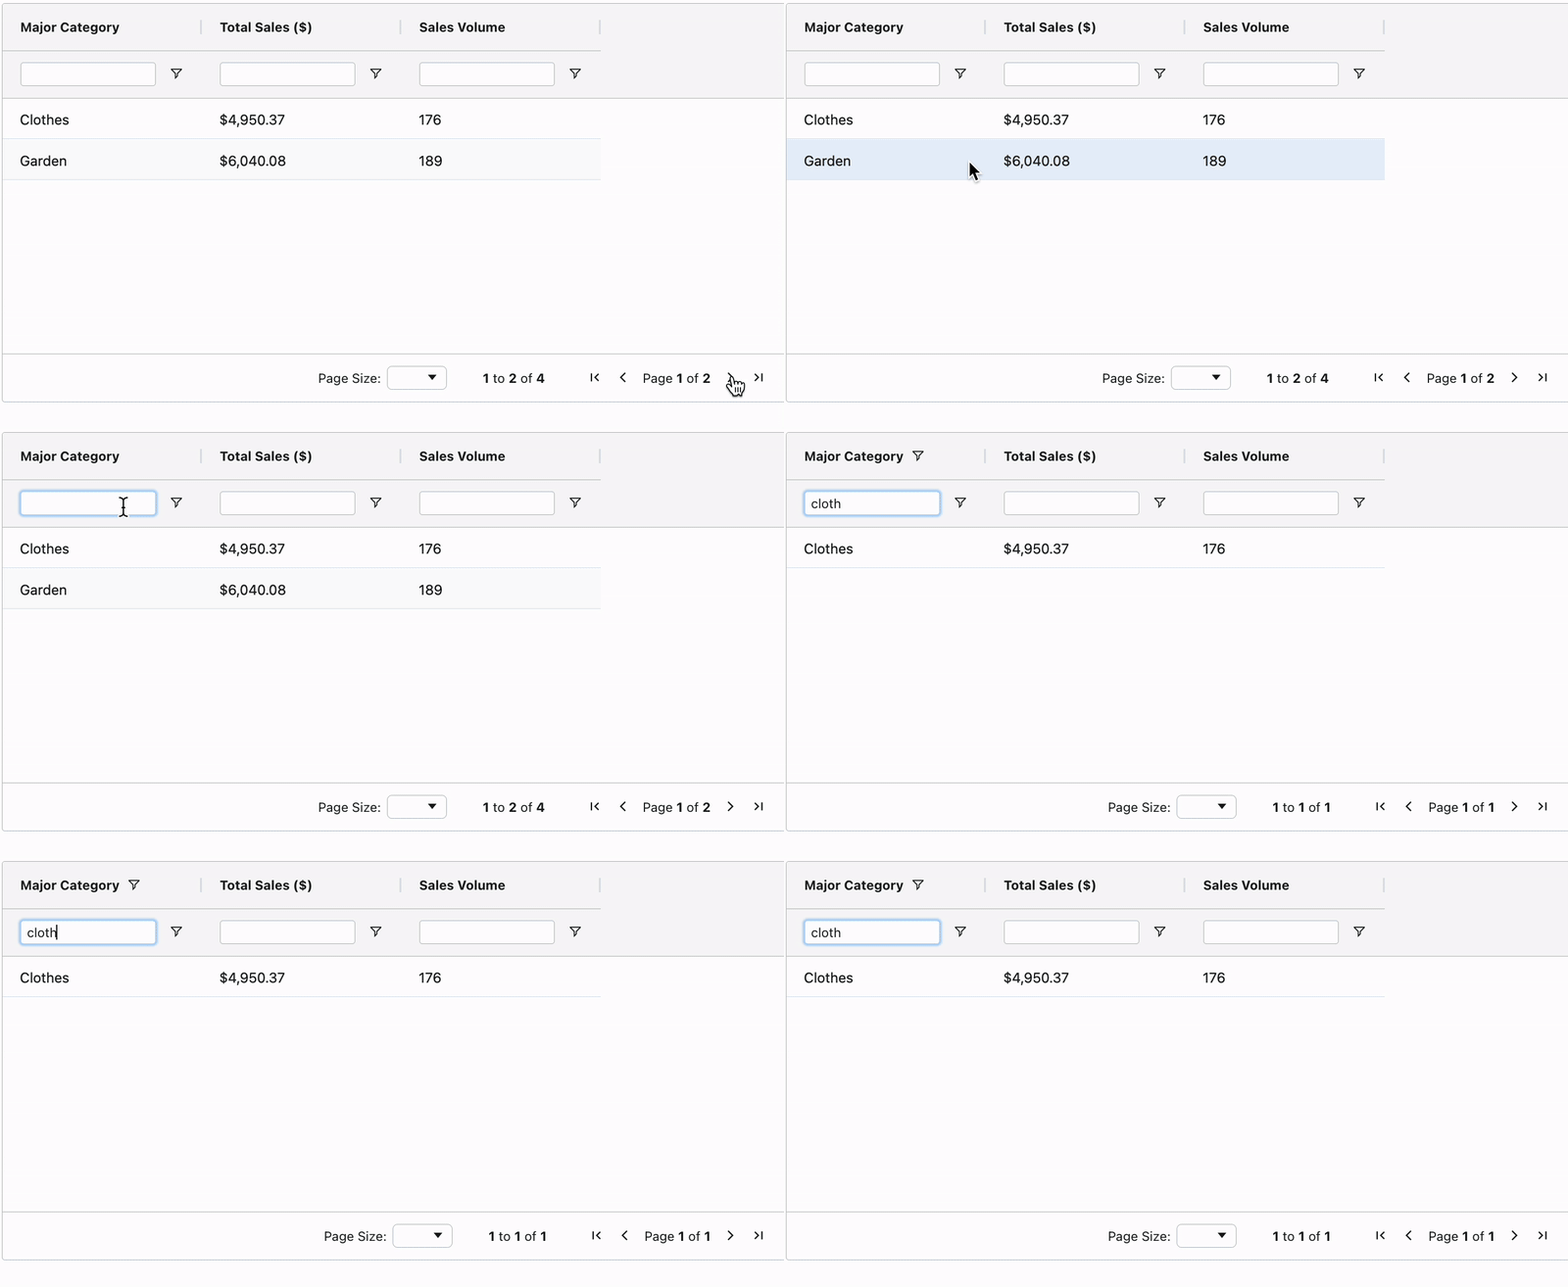
GIF ของตารางพื้นฐาน แสดงเพียง 2 แถวข้อมูล และมีปุ่ม pagination ที่มุมขวาล่างพร้อมลูกศรซ้าย-ขวาและตัวนับหน้า

  • การเรียงลำดับและกรองใช้กับตารางทั้งหมด 📌
การสร้างแดชบอร์ดด้วย Dash และ Plotly

มาฝึกกันเถอะ!

การสร้างแดชบอร์ดด้วย Dash และ Plotly

Preparing Video For Download...