จาก Plotly สู่ Dash
การสร้างแดชบอร์ดด้วย Dash และ Plotly

Alex Scriven
Data Scientist
แอปของเรา
เข้าถึงได้ผ่านเว็บเบราว์เซอร์ เช่น Google Chrome
ขณะที่เซิร์ฟเวอร์ทำงานอยู่ แก้ไขและบันทึกไฟล์
.pyเพื่อดูการเปลี่ยนแปลงแบบ live ในเบราว์เซอร์

แอปของเราในเบราว์เซอร์
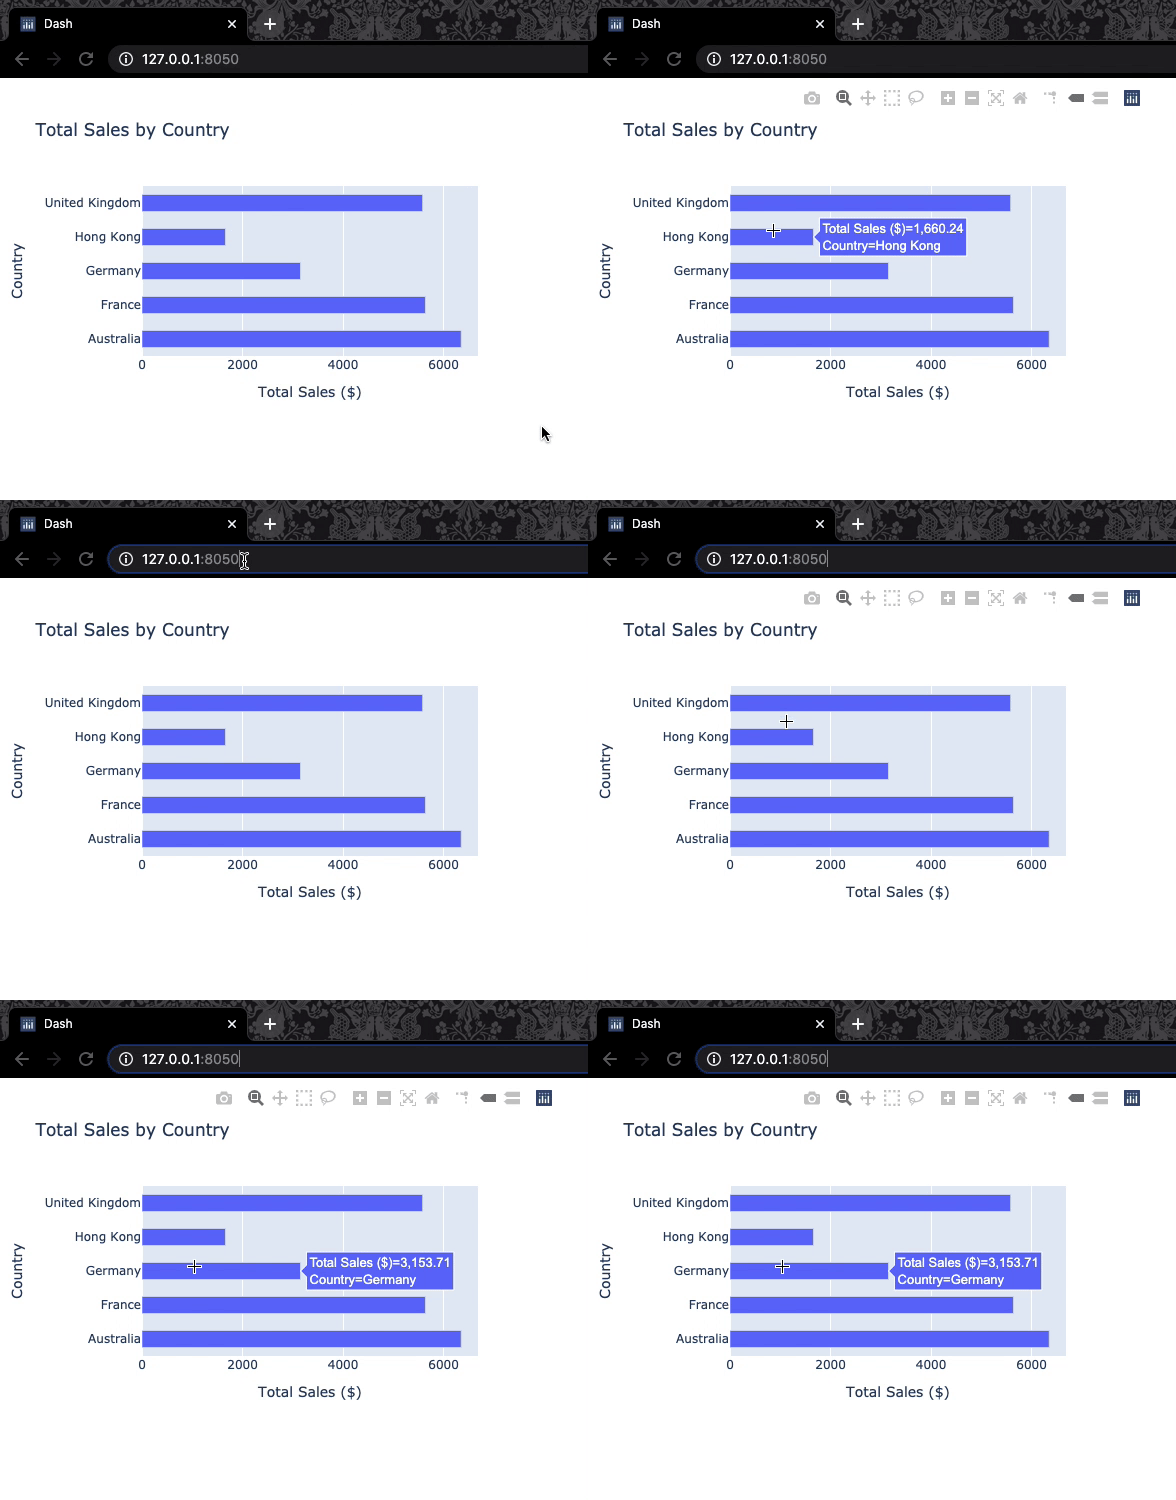
Dash ใน DataCamp
- ความแตกต่างจากแบบฝึกหัด DataCamp อื่น ๆ:
- มีบรรทัด setup ที่ด้านบนของแบบฝึกหัด
- รันทั้งหมดพร้อมกัน (ไม่ใช่ทีละบรรทัด)
- โค้ดยาวกว่า (มาก)
- ได้ dashboard ที่ใช้งานได้จริง (ขยายหน้าต่างเพื่อดู!)


