การแสดงภาพผลผลิตธัญพืช

Introduction to Writing Functions in R

Richie Cotton

Data Evangelist at DataCamp

ชุดข้อมูล corn

glimpse(corn)
Observations: 6,381
Variables: 6
$ year                   <int> 1866, 1866, 1866, 1866, 1866, 1866...
$ state                  <chr> "Alabama", "Arkansas", "California...
$ farmed_area_acres      <dbl> 1050000, 280000, 42000, 57000, 200...
$ yield_bushels_per_acre <dbl> 9.0, 18.0, 28.0, 34.0, 23.0, 9.0, ...
$ farmed_area_ha         <dbl> 424919.92, 113311.98, 16996.80, 23...
$ yield_kg_per_ha        <dbl> 79.29892, 158.59784, 246.70776, 29...
Introduction to Writing Functions in R

ggplot2: การวาดหลายเส้น

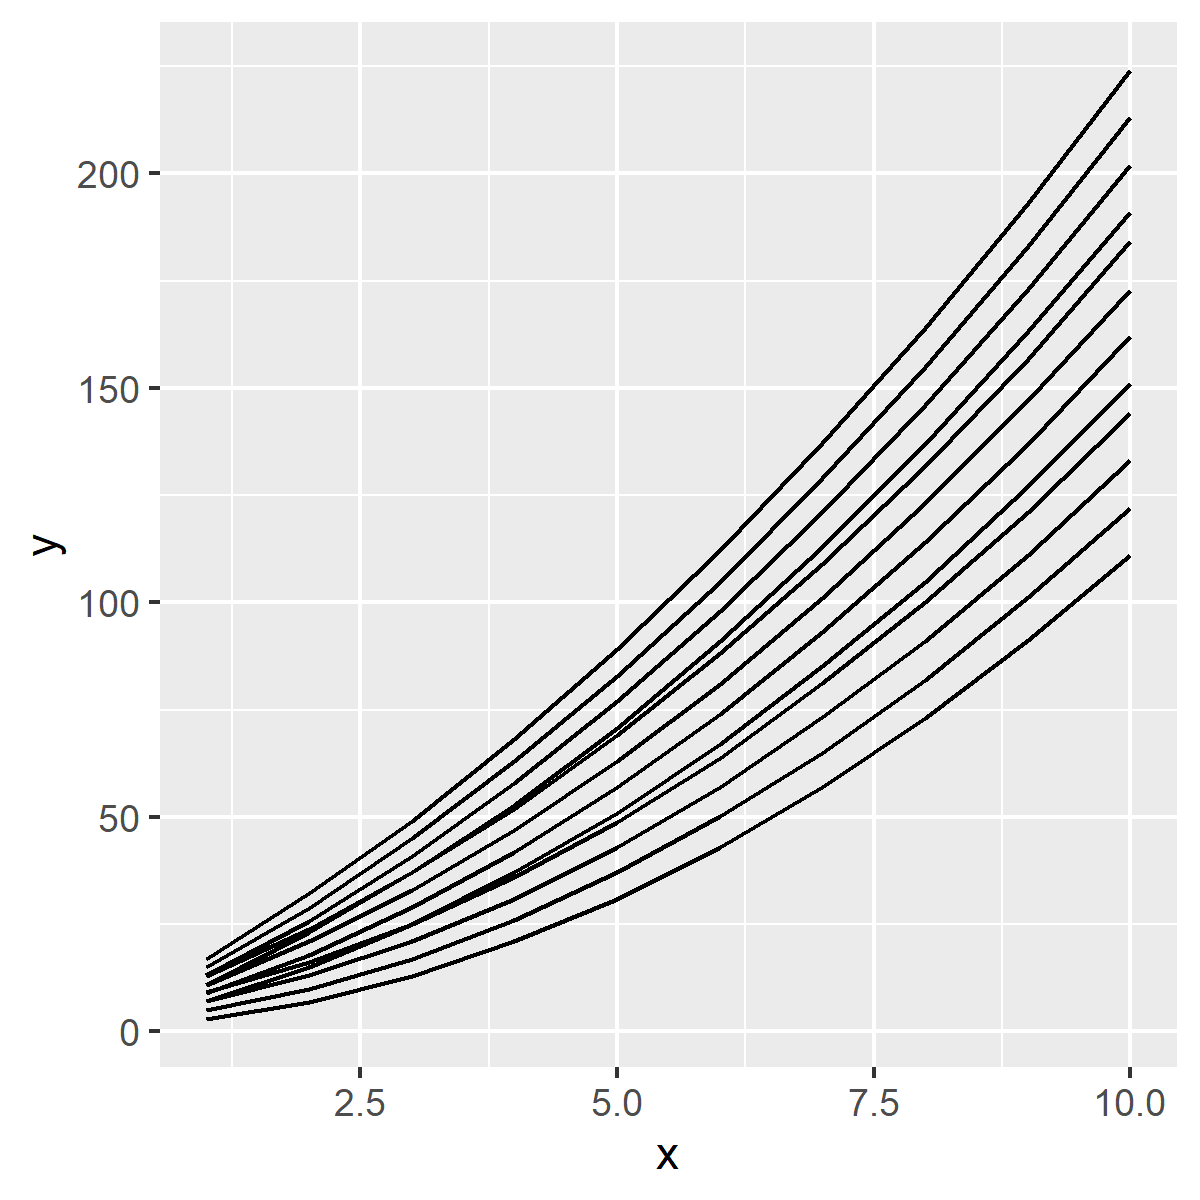
ggplot(dataset, aes(x, y)) +
  geom_line(aes(group = group))

กราฟเส้นที่มีหลายเส้น โดยแต่ละเส้นถูกจัดกลุ่มตามคอลัมน์ group ในชุดข้อมูล

Introduction to Writing Functions in R

ggplot2: แนวโน้มแบบ smooth

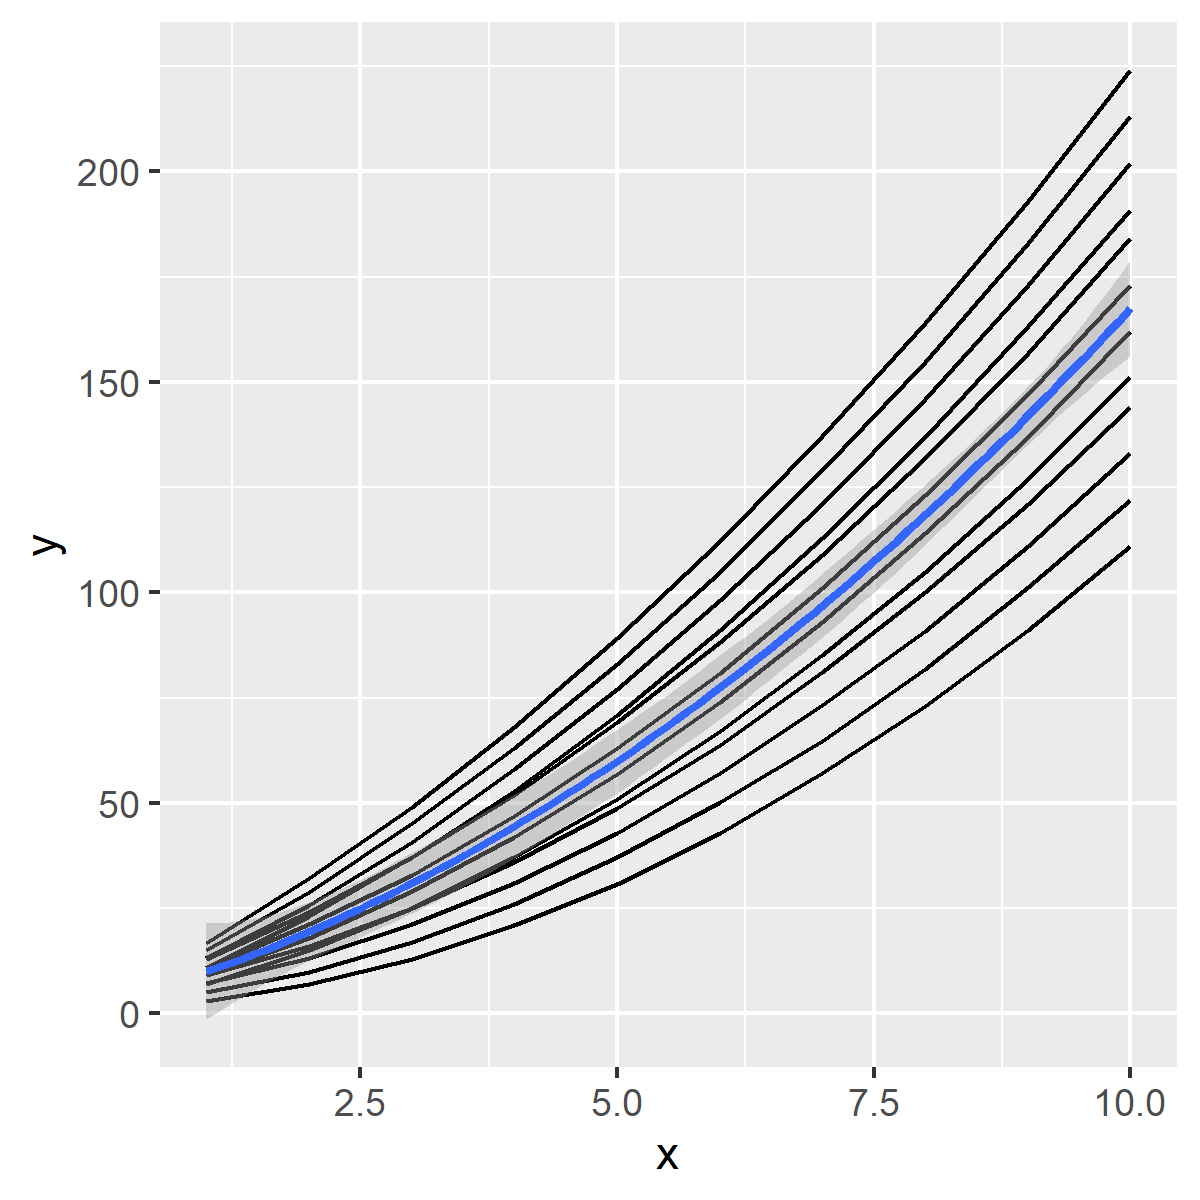
ggplot(dataset, aes(x, y)) +
  geom_line(aes(group = group)) +
  geom_smooth()

กราฟเส้นเดิมจากสไลด์ก่อนหน้า แต่มีเส้นแนวโน้มแบบ smooth เพิ่มเข้ามา เส้นนี้ไม่ถูกจัดกลุ่ม เนื่องจาก aesthetic group อยู่ใน geom ของเส้น ไม่ใช่ของพล็อตทั้งหมด

Introduction to Writing Functions in R

ggplot2: การแบ่งแผง (facetting)

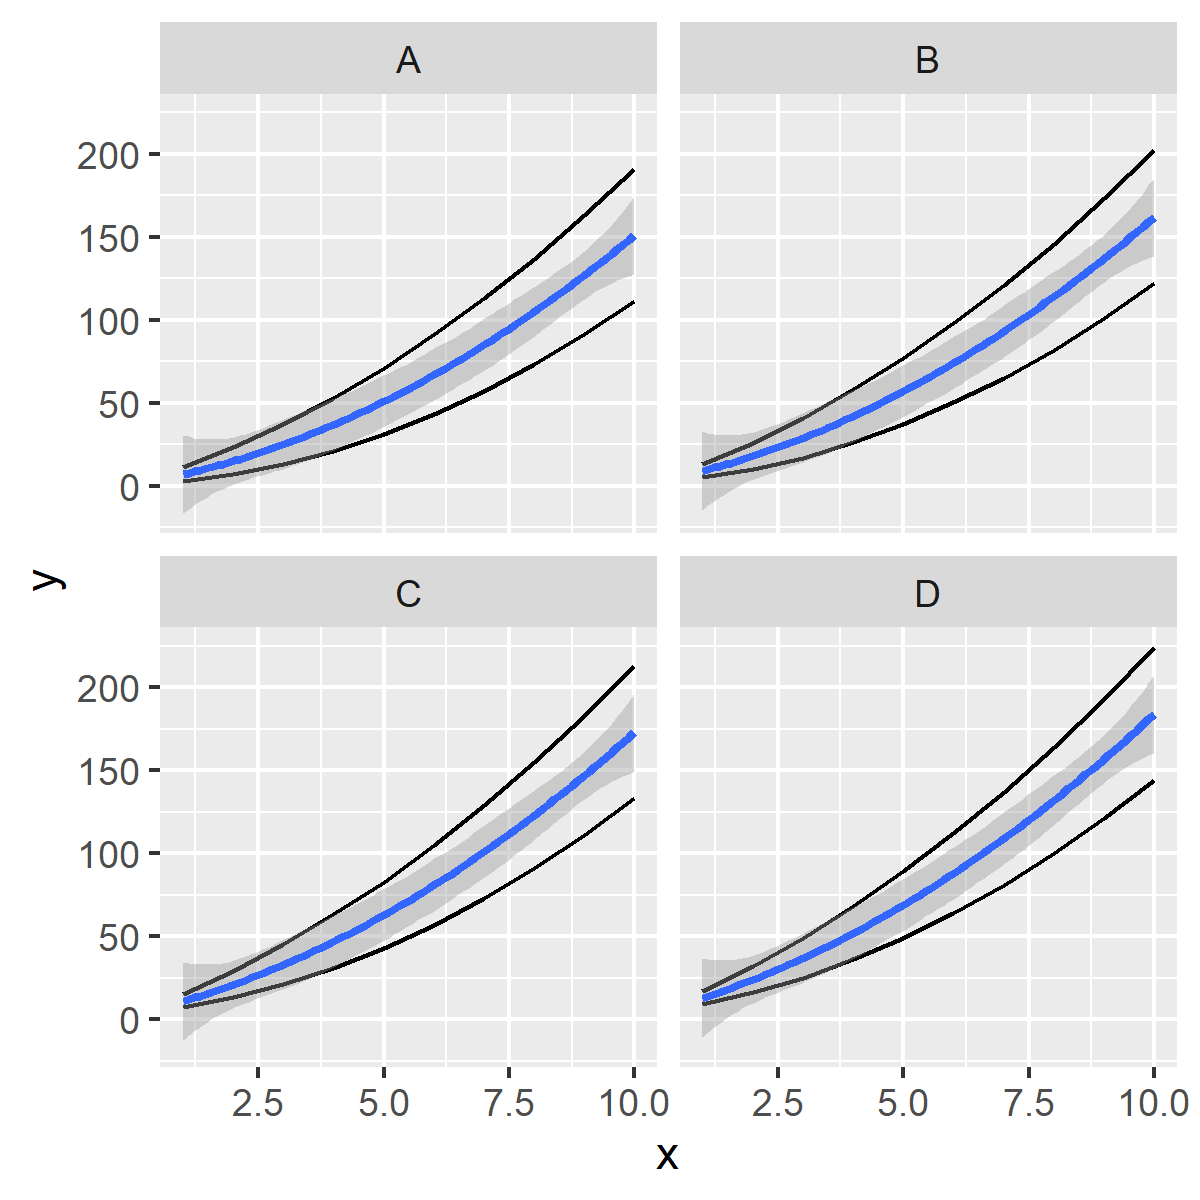
ggplot(dataset, aes(x, y)) +
  geom_line(aes(group = group)) +
  geom_smooth() +
  facet_wrap(vars(facet))

กราฟเดิม แต่แบ่งออกเป็น 4 แผง ติดป้ายกำกับ 'A' ถึง 'D' จากการเรียกใช้ facet_wrap

Introduction to Writing Functions in R

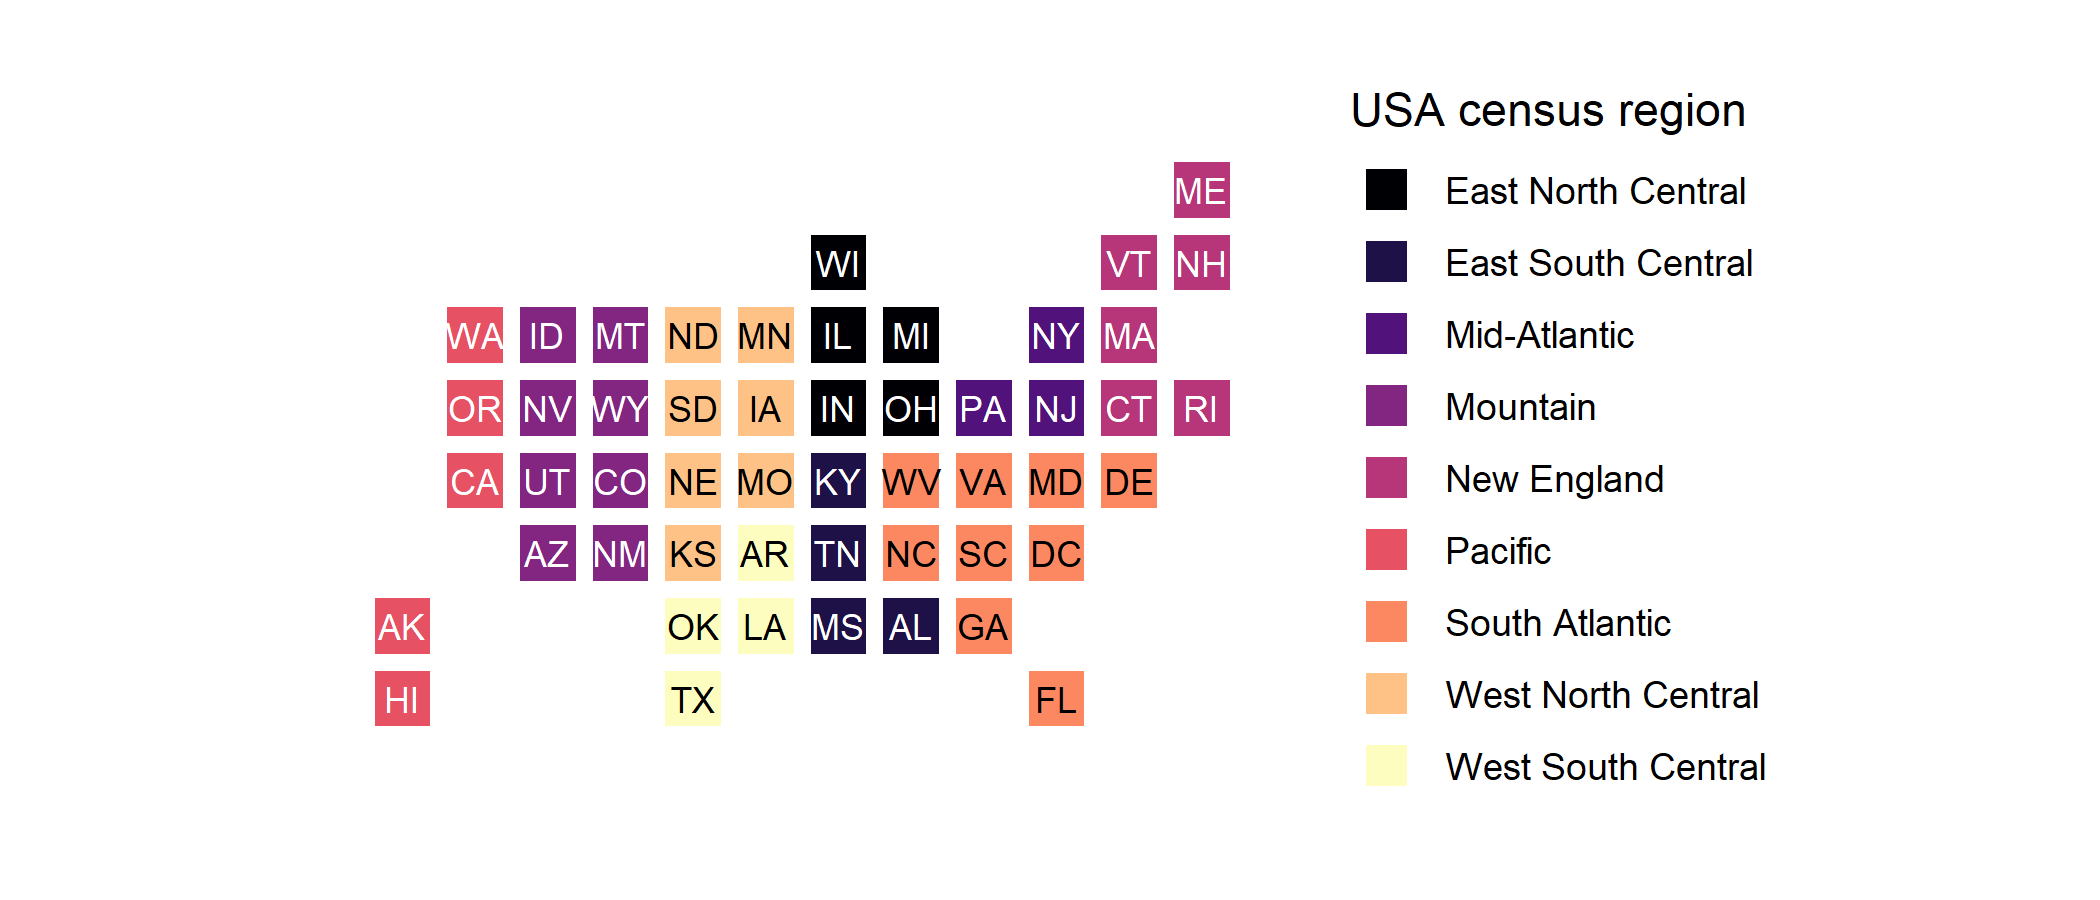
ภูมิภาคสำมะโนประชากรของสหรัฐฯ

กราฟ statebin แสดงแต่ละรัฐของสหรัฐฯ เป็นสี่เหลี่ยม จัดเรียงในรูปแบบที่คล้ายแผนที่สหรัฐฯ แต่ละภูมิภาคสำมะโนประชากรมีสีแตกต่างกัน

Introduction to Writing Functions in R

การ inner join ด้วย dplyr

dataset1 %>%
  inner_join(dataset2, by = "column_to_join_on")
Introduction to Writing Functions in R

มาฝึกกันเถอะ!

Introduction to Writing Functions in R

Preparing Video For Download...