กลยุทธ์สินเชื่อและการสูญเสียที่คาดหวังขั้นต่ำ

การสร้างโมเดลความเสี่ยงด้านเครดิตด้วย Python

Michael Crabtree

Data Scientist, Ford Motor Company

การเลือกอัตราการอนุมัติ

  • อัตราการอนุมัติเริ่มต้นอยู่ที่ 85% แต่สามารถเลือกอัตราอื่นได้เช่นกัน
  • มี 2 วิธีในการทดสอบอัตราต่าง ๆ:
    • คำนวณ threshold, bad rate และการสูญเสียด้วยตนเอง
    • สร้างตารางค่าเหล่านี้โดยอัตโนมัติและเลือกอัตราการอนุมัติ
  • ตารางที่รวบรวมค่าที่เป็นไปได้ทั้งหมดเรียกว่า strategy table
การสร้างโมเดลความเสี่ยงด้านเครดิตด้วย Python

การตั้งค่า strategy table

  • ตั้งค่า array หรือ list เพื่อเก็บค่าแต่ละอย่าง
# Set all the acceptance rates to test
accept_rates = [1.0, 0.95, 0.9, 0.85, 0.8, 0.75, 0.7, 0.65, 0.6, 0.55,
                0.5, 0.45, 0.4, 0.35, 0.3, 0.25, 0.2, 0.15, 0.1, 0.05]
# Create lists to store thresholds and bad rates 
thresholds = []
bad_rates = []
การสร้างโมเดลความเสี่ยงด้านเครดิตด้วย Python

การคำนวณค่าในตาราง

  • คำนวณ threshold และ bad rate สำหรับทุกอัตราการอนุมัติ
for rate in accept_rates:
    # Calculate threshold
    threshold = np.quantile(preds_df['prob_default'], rate).round(3)
    # Store threshold value in a list
    thresholds.append(np.quantile(preds_gbt['prob_default'], rate).round(3))
    # Apply the threshold to reassign loan_status
    test_pred_df['pred_loan_status'] = \ 
        test_pred_df['prob_default'].apply(lambda x: 1 if x > thresh else 0)
    # Create accepted loans set of predicted non-defaults
    accepted_loans = test_pred_df[test_pred_df['pred_loan_status'] == 0]
    # Calculate and store bad rate
    bad_rates.append(np.sum((accepted_loans['true_loan_status']) 
             / accepted_loans['true_loan_status'].count()).round(3))
การสร้างโมเดลความเสี่ยงด้านเครดิตด้วย Python

การตีความ strategy table

strat_df = pd.DataFrame(zip(accept_rates, thresholds, bad_rates),
                        columns = ['Acceptance Rate','Threshold','Bad Rate'])
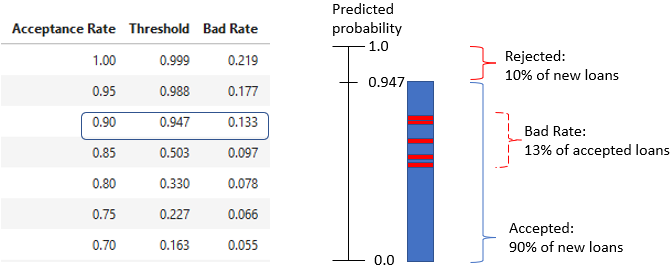
ตัวอย่าง strategy table และแผนภูมิ bad rate

การสร้างโมเดลความเสี่ยงด้านเครดิตด้วย Python

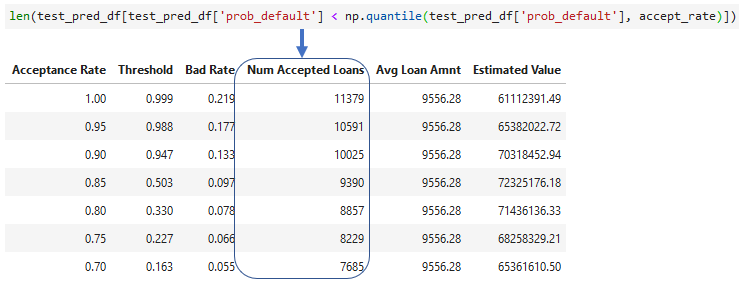
การเพิ่มจำนวนสินเชื่อที่อนุมัติ

  • จำนวนสินเชื่อที่ได้รับการอนุมัติในแต่ละอัตราการอนุมัติ
    • ใช้ len() หรือ .count() ได้

Strategy table พร้อมจำนวนสินเชื่อที่อนุมัติ

การสร้างโมเดลความเสี่ยงด้านเครดิตด้วย Python

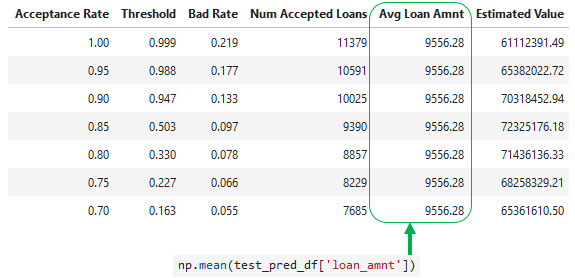
การเพิ่มวงเงินสินเชื่อเฉลี่ย

  • ค่าเฉลี่ย loan_amnt จากชุดข้อมูลทดสอบ

Strategy table พร้อมวงเงินสินเชื่อเฉลี่ย

การสร้างโมเดลความเสี่ยงด้านเครดิตด้วย Python

การประมาณมูลค่าพอร์ตสินเชื่อ

  • มูลค่าเฉลี่ยของสินเชื่อที่อนุมัติและไม่ผิดนัดชำระ ลบด้วยมูลค่าเฉลี่ยของสินเชื่อที่ผิดนัดชำระ
  • สมมติว่าการผิดนัดชำระแต่ละครั้งคือการสูญเสียเท่ากับ loan_amnt
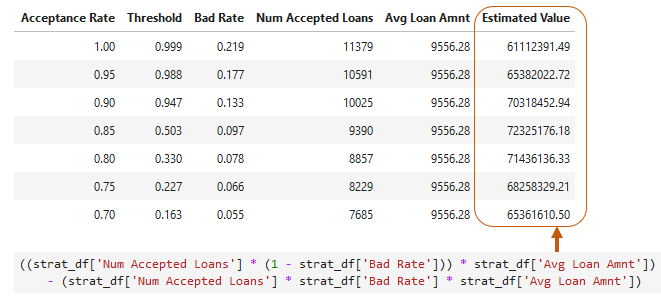
Strategy table พร้อมมูลค่าประมาณการ

การสร้างโมเดลความเสี่ยงด้านเครดิตด้วย Python

การสูญเสียที่คาดหวังทั้งหมด

  • จำนวนที่คาดว่าจะสูญเสียจากการผิดนัดชำระในพอร์ตสินเชื่อ

สูตรคำนวณการสูญเสียที่คาดหวังทั้งหมด

# Probability of default (PD)
test_pred_df['prob_default']
# Exposure at default = loan amount (EAD)
test_pred_df['loan_amnt']
# Loss given default = 1.0 for total loss (LGD)
test_pred_df['loss_given_default']
การสร้างโมเดลความเสี่ยงด้านเครดิตด้วย Python

มาฝึกกันเถอะ!

การสร้างโมเดลความเสี่ยงด้านเครดิตด้วย Python

Preparing Video For Download...