การจัดกลุ่มด้วยหลายฟีเจอร์

การวิเคราะห์กลุ่มข้อมูลใน Python

Shaumik Daityari

Business Analyst

การตรวจสอบเบื้องต้น

# Cluster centers
print(fifa.groupby('cluster_labels')[['scaled_heading_accuracy', 
    'scaled_volleys', 'scaled_finishing']].mean())
cluster_labels scaled_heading_accuracy scaled_volleys scaled_finishing
0 3.21 2.83 2.76
1 0.71 0.64 0.58
# Cluster sizes
print(fifa.groupby('cluster_labels')['ID'].count())
cluster_labels count
0 886
1 114
การวิเคราะห์กลุ่มข้อมูลใน Python

การแสดงผลข้อมูล

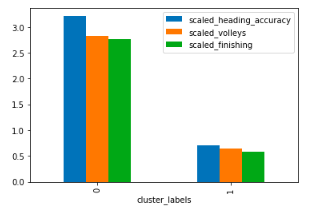
  • แสดงผลศูนย์กลางคลัสเตอร์
  • แสดงผลตัวแปรอื่นในแต่ละคลัสเตอร์


# Plot cluster centers
fifa.groupby('cluster_labels') \
  [scaled_features].mean()
  .plot(kind='bar')
plt.show()

การวิเคราะห์กลุ่มข้อมูลใน Python

รายการอันดับต้นในแต่ละคลัสเตอร์

# Get the name column of top 5 players in each cluster
for cluster in fifa['cluster_labels'].unique():
    print(cluster, fifa[fifa['cluster_labels'] == cluster]['name'].values[:5])
Cluster Label Top Players
0 ['Cristiano Ronaldo' 'L. Messi' 'Neymar' 'L. Suárez' 'R. Lewandowski']
1 ['M. Neuer' 'De Gea' 'G. Buffon' 'T. Courtois' 'H. Lloris']
การวิเคราะห์กลุ่มข้อมูลใน Python

การลดมิติฟีเจอร์

  • การวิเคราะห์ปัจจัย
  • การปรับสเกลหลายมิติ
การวิเคราะห์กลุ่มข้อมูลใน Python

แบบฝึกหัดสุดท้าย!

การวิเคราะห์กลุ่มข้อมูลใน Python

Preparing Video For Download...