พื้นฐานการวิเคราะห์คลัสเตอร์

การวิเคราะห์กลุ่มข้อมูลใน Python

Shaumik Daityari

Business Analyst

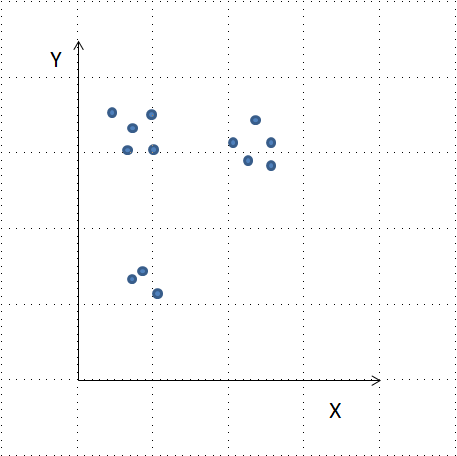
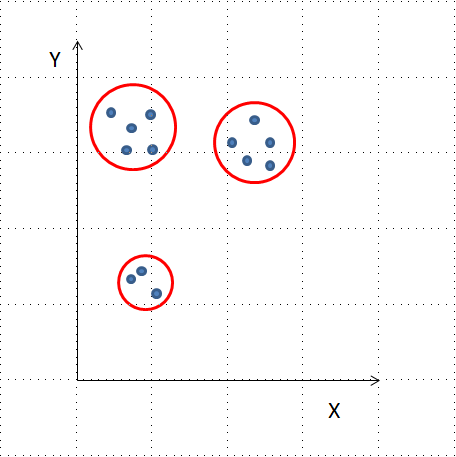
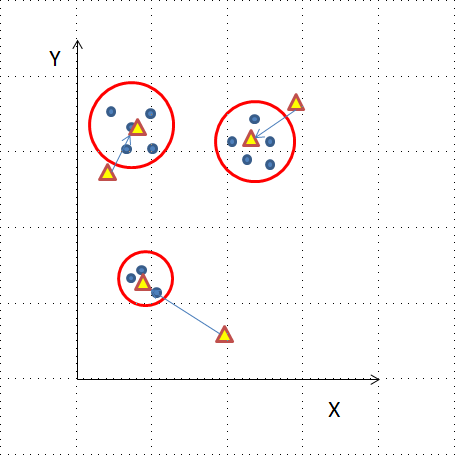
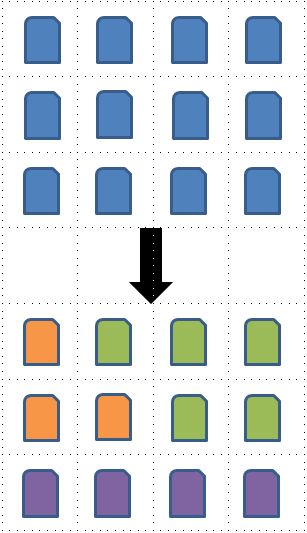
คลัสเตอร์คืออะไร?

  • กลุ่มของรายการที่มีลักษณะคล้ายคลึงกัน
  • Google News: บทความที่มีคำและความสัมพันธ์ของคำปรากฏร่วมกัน
  • กลุ่มลูกค้า

การวิเคราะห์กลุ่มข้อมูลใน Python

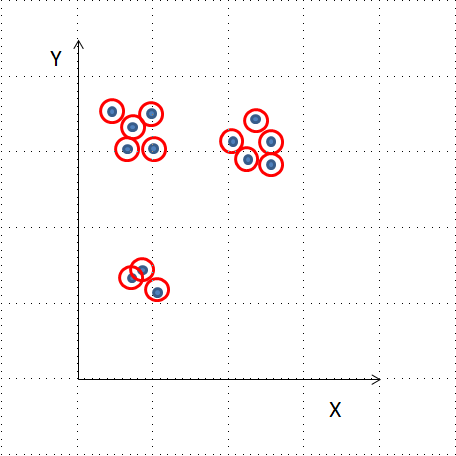
อัลกอริทึมการจัดกลุ่ม

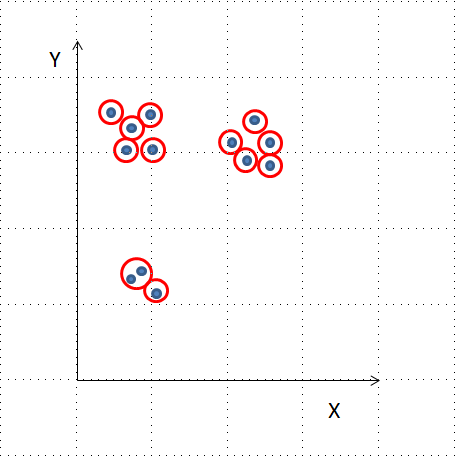
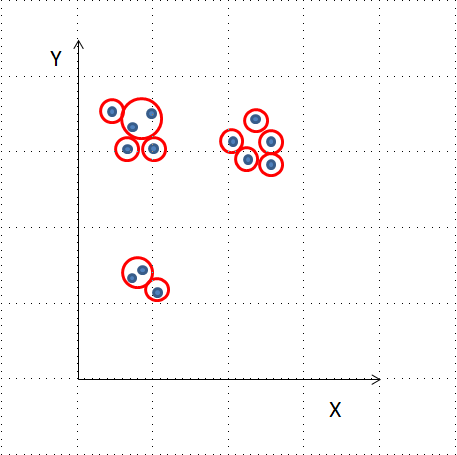
  • Hierarchical clustering
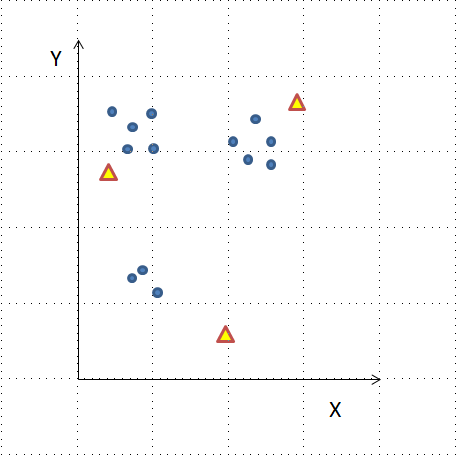
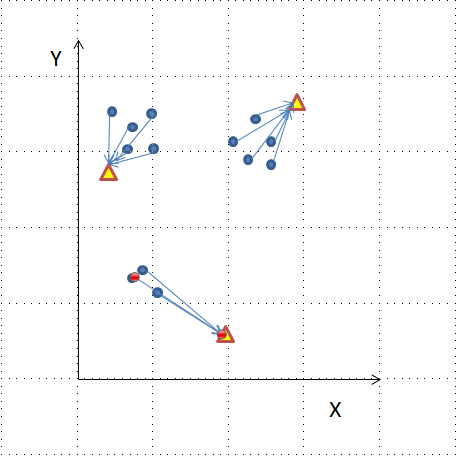
  • K-means clustering
  • อัลกอริทึมการจัดกลุ่มอื่น ๆ: DBSCAN, Gaussian Methods
การวิเคราะห์กลุ่มข้อมูลใน Python

การวิเคราะห์กลุ่มข้อมูลใน Python

การวิเคราะห์กลุ่มข้อมูลใน Python

การวิเคราะห์กลุ่มข้อมูลใน Python

การวิเคราะห์กลุ่มข้อมูลใน Python

การวิเคราะห์กลุ่มข้อมูลใน Python

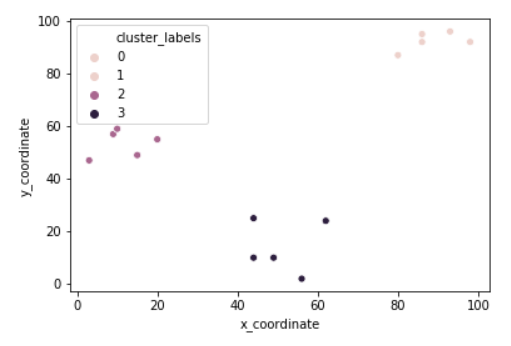
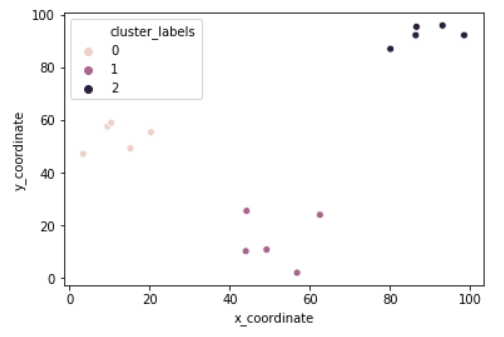
Hierarchical clustering ใน SciPy

from scipy.cluster.hierarchy import linkage, fcluster
from matplotlib import pyplot as plt
import seaborn as sns, pandas as pd
x_coordinates = [80.1, 93.1, 86.6, 98.5, 86.4, 9.5, 15.2, 3.4, 
                 10.4, 20.3, 44.2, 56.8, 49.2, 62.5, 44.0]
y_coordinates = [87.2, 96.1, 95.6, 92.4, 92.4, 57.7, 49.4, 
                 47.3, 59.1, 55.5, 25.6, 2.1, 10.9, 24.1, 10.3]

df = pd.DataFrame({'x_coordinate': x_coordinates,
                   'y_coordinate': y_coordinates})
Z = linkage(df, 'ward')
df['cluster_labels'] = fcluster(Z, 3, criterion='maxclust')
sns.scatterplot(x='x_coordinate', y='y_coordinate', 
                hue='cluster_labels', data = df)
plt.show()
การวิเคราะห์กลุ่มข้อมูลใน Python

การวิเคราะห์กลุ่มข้อมูลใน Python

การวิเคราะห์กลุ่มข้อมูลใน Python

การวิเคราะห์กลุ่มข้อมูลใน Python

การวิเคราะห์กลุ่มข้อมูลใน Python

การวิเคราะห์กลุ่มข้อมูลใน Python

K-means clustering ใน SciPy

from scipy.cluster.vq import kmeans, vq
from matplotlib import pyplot as plt
import seaborn as sns, pandas as pd

import random
random.seed((1000,2000))
x_coordinates = [80.1, 93.1, 86.6, 98.5, 86.4, 9.5, 15.2, 3.4, 
                 10.4, 20.3, 44.2, 56.8, 49.2, 62.5, 44.0]
y_coordinates = [87.2, 96.1, 95.6, 92.4, 92.4, 57.7, 49.4, 
                 47.3, 59.1, 55.5, 25.6, 2.1, 10.9, 24.1, 10.3]

df = pd.DataFrame({'x_coordinate': x_coordinates, 'y_coordinate': y_coordinates})
centroids,_ = kmeans(df, 3)
df['cluster_labels'], _ = vq(df, centroids)
sns.scatterplot(x='x_coordinate', y='y_coordinate', 
                hue='cluster_labels', data = df)
plt.show()
การวิเคราะห์กลุ่มข้อมูลใน Python

การวิเคราะห์กลุ่มข้อมูลใน Python

ถัดไป: แบบฝึกหัดลงมือทำ

การวิเคราะห์กลุ่มข้อมูลใน Python

Preparing Video For Download...